광고 기반 스트리밍의 대세화: 2025년 미국 SVOD 시장 구조, 소비자 선택, 산업적 함의(The Rise of Ad-Supported Streaming: How Advertising Tiers Are Reshaping the U.S. Subscription Economy)

1. 광고 기반 스트리밍의 대세화
광고 요금제의 확산
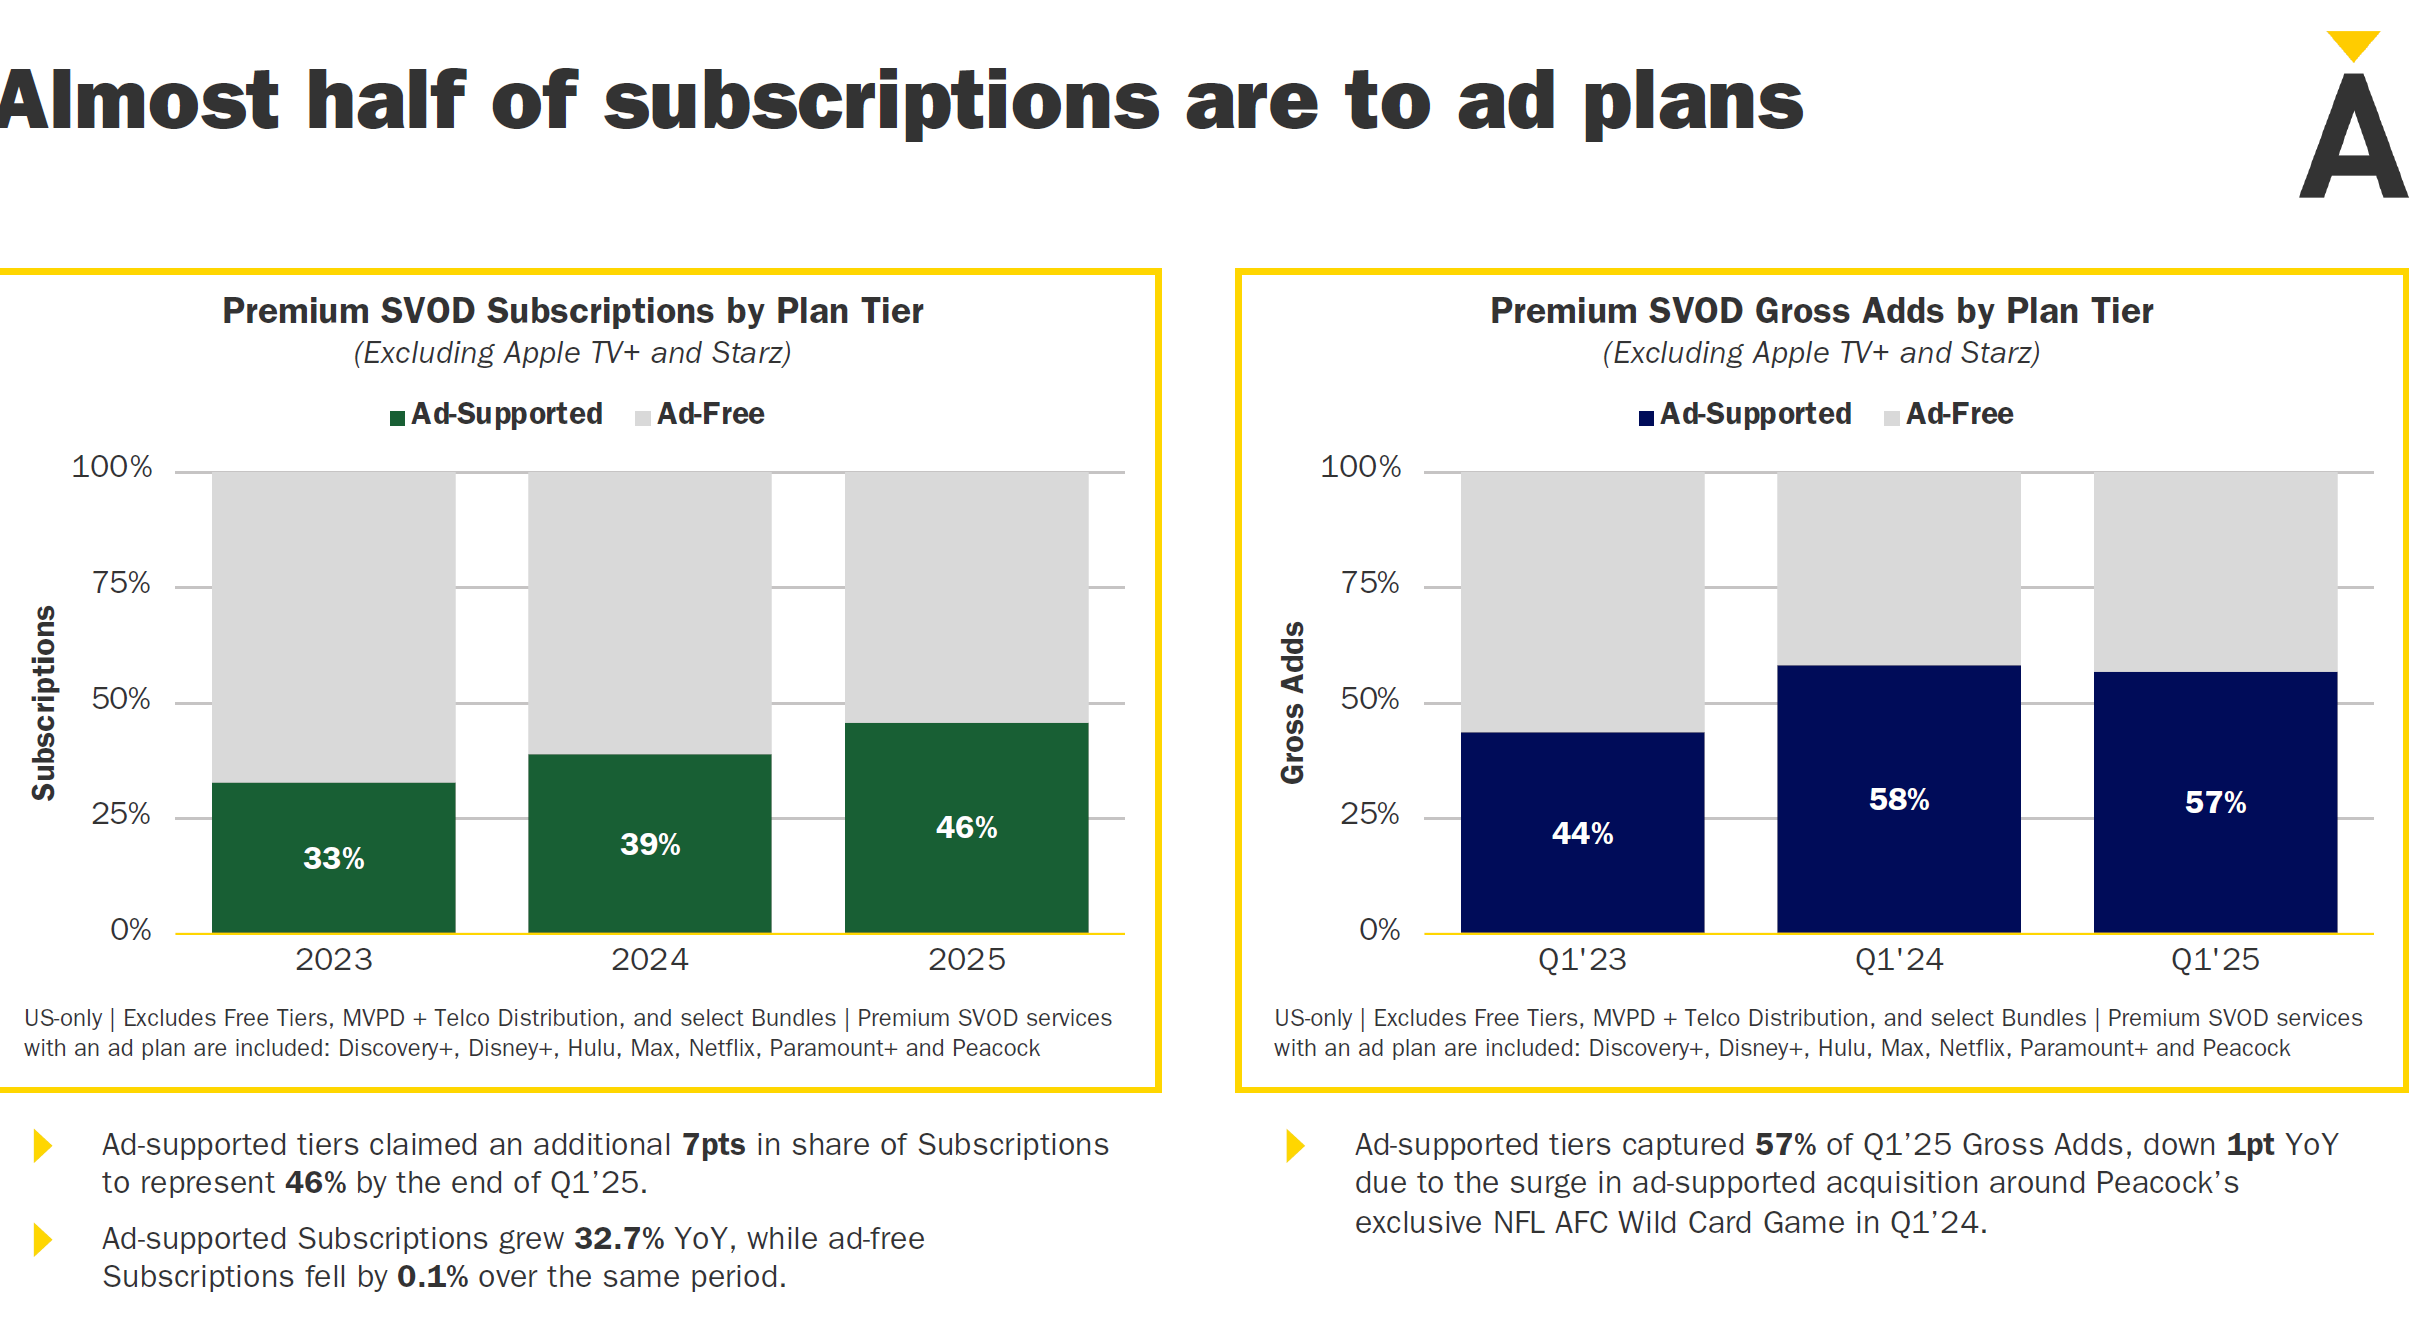
불과 2년 전만 해도 미국 프리미엄 SVOD(유료 스트리밍) 서비스의 절반은 광고 요금제를 제공하지 않았고, 전체 가입자의 3분의 1만 광고 요금제를 사용했다. 2025년 1분기 기준, 광고 요금제는 전체 프리미엄 SVOD 가입자의 46%까지 확대됐다. 이는 1년 전보다 7%p 증가한 수치로, 광고 요금제의 비중이 빠르게 커지고 있음을 보여준다.
시장 성장 견인
지난 9분기(약 2년 3개월) 동안 프리미엄 SVOD 신규 순증 가입자의 71%가 광고 요금제에서 발생했다. 2024년 한 해 동안 신규 가입자의 57%가 광고 요금제를 선택했다. 광고 요금제 가입자 수는 전년 대비 32.7% 증가한 반면, 광고 없는 요금제는 0.1% 감소했다. 미국 내 광고 요금제 가입자 수는 약 1억 명에 달한다(아마존 프라임 비디오 제외)1.
광고 요금제의 신규 유입 효과
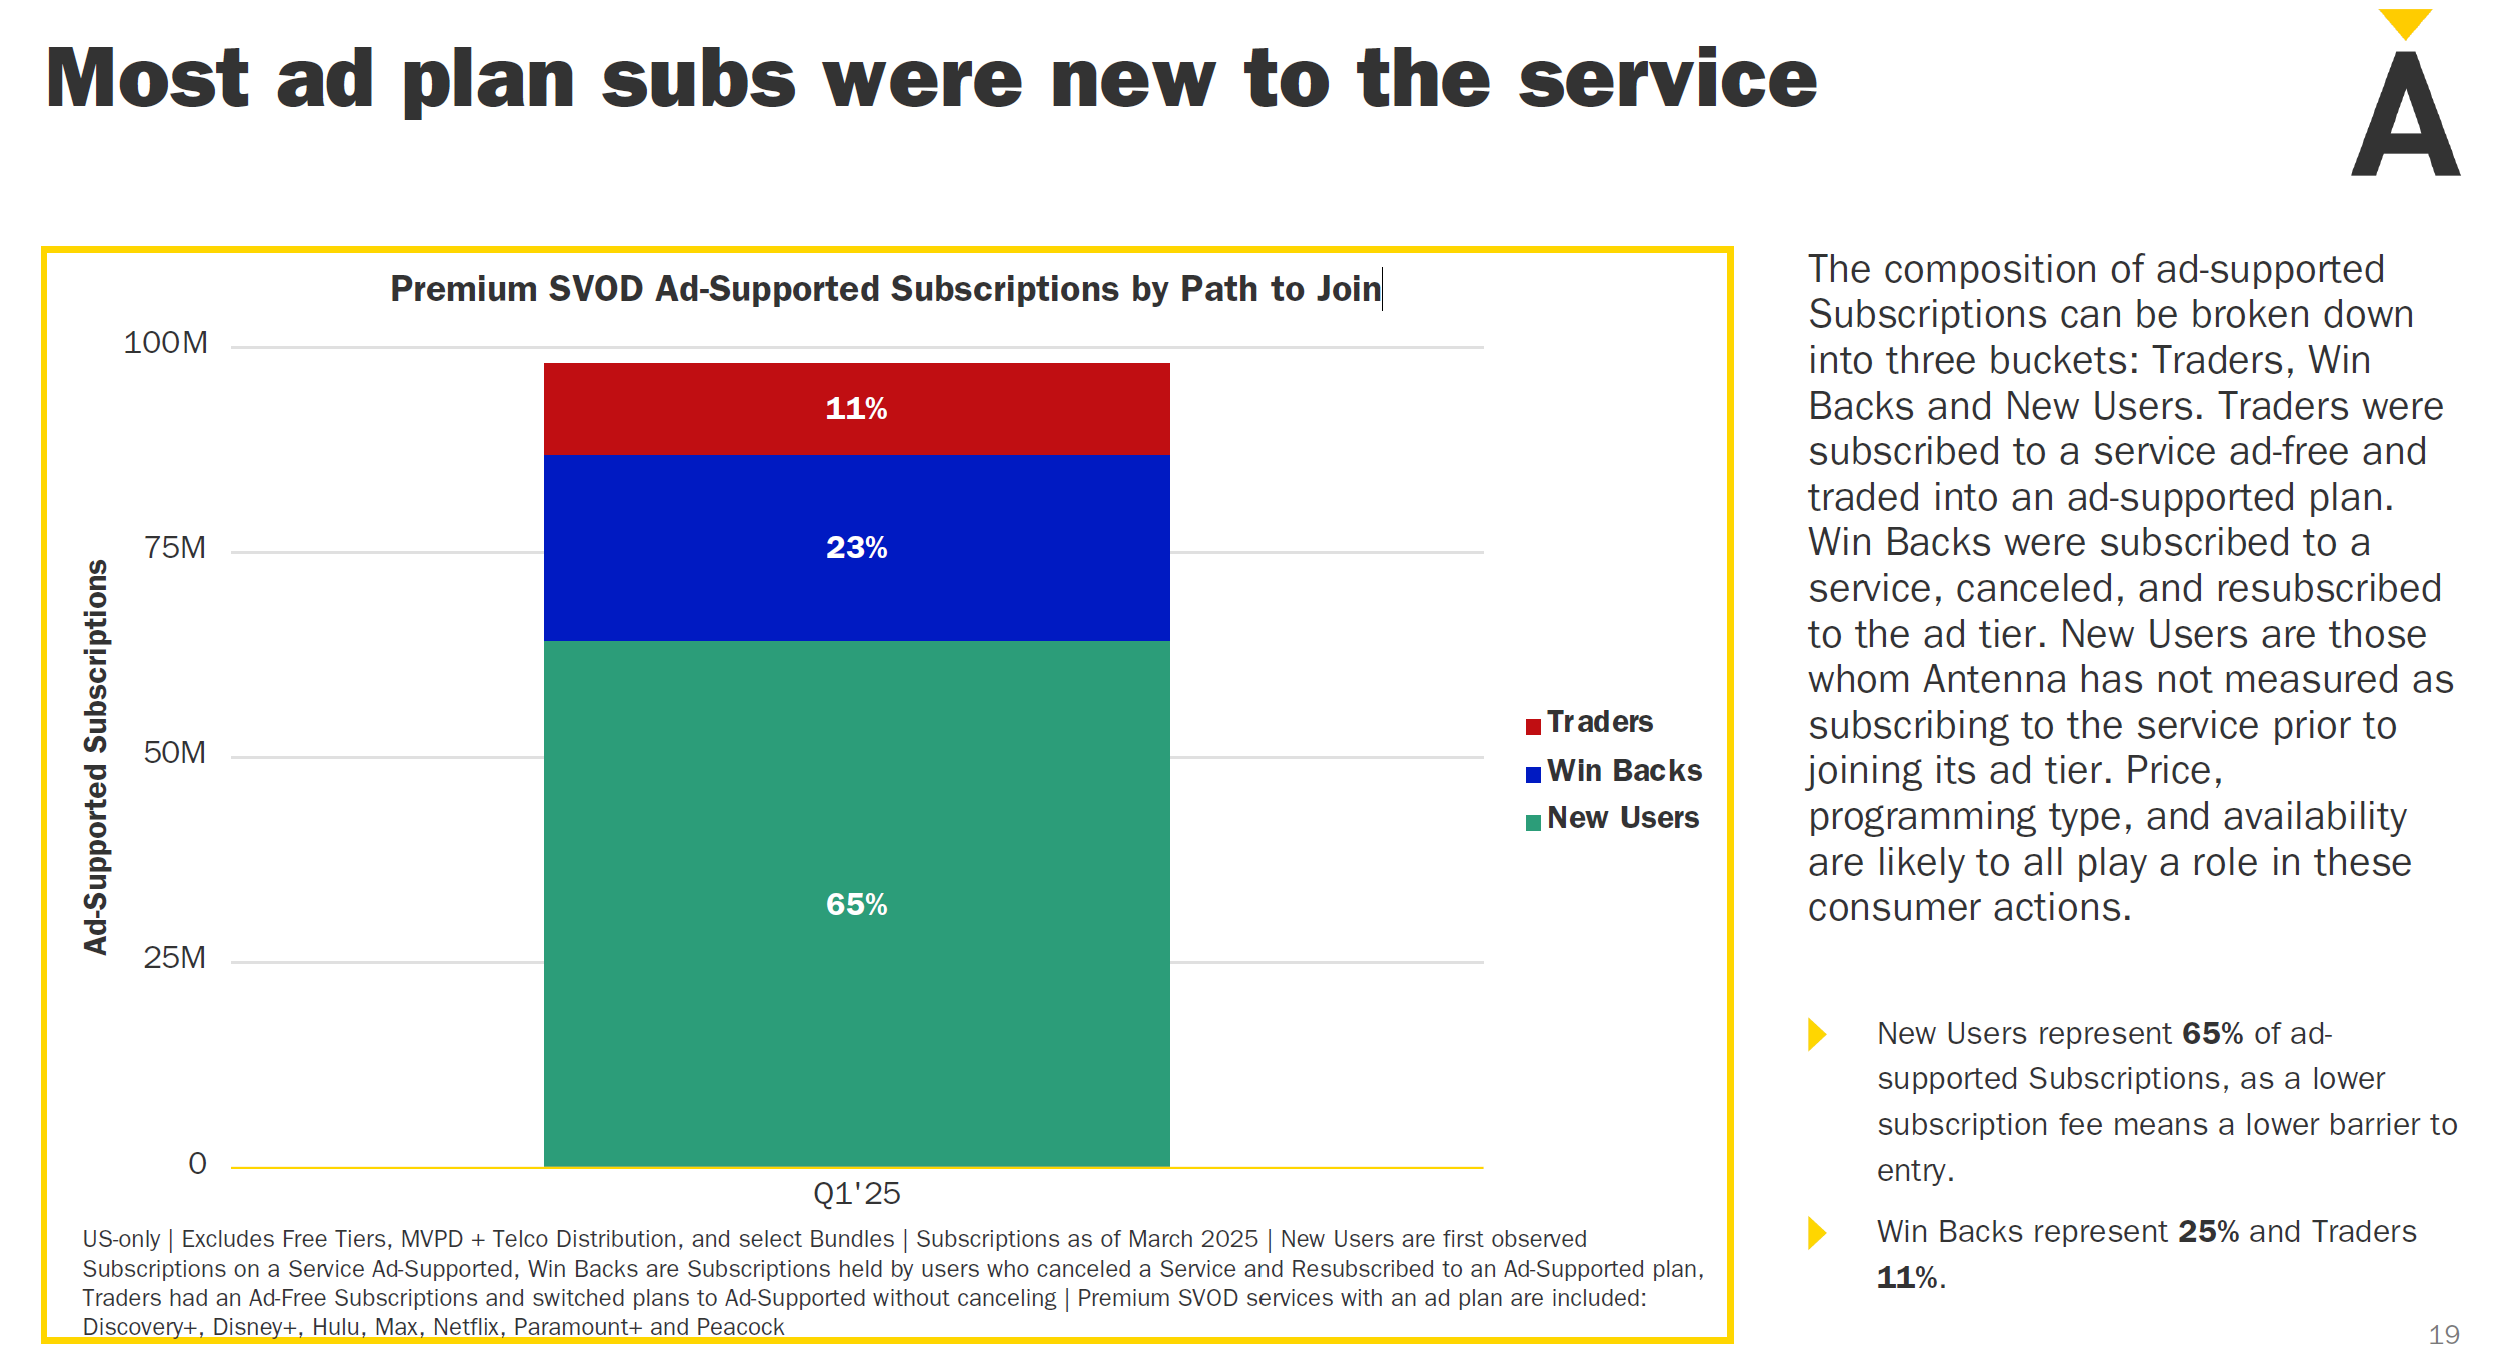
광고 요금제 가입자 중 65%는 해당 서비스에 처음 가입하는 신규 유입자, 23%는 해지 후 재가입(‘윈백’), 11%는 기존 광고 없는 요금제에서 전환(‘트레이더’)로 구성된다.
1. The Rise of Ad-Supported Streaming
Expansion of Ad Tiers
Just two years ago, roughly half of all premium SVOD (subscription-based streaming) services in the U.S. did not offer ad-supported plans. Only about one-third of subscribers were on ad-supported tiers. As of Q1 2025, however, 46% of all premium SVOD subscribers now use an ad-supported plan. This figure is up 7 percentage points from a year earlier, demonstrating the swift growth of ad tiers in the market.
Driving Overall Market Growth
Over the past nine quarters (approximately 2 years and 3 months), 71% of net new premium SVOD subscribers came from ad-supported plans. In 2024 alone, 57% of new subscribers chose ad-supported tiers. Year over year, ad-supported plan subscribers grew by 32.7%, whereas ad-free tiers declined by 0.1%. Across all services (excluding Amazon Prime Video), there are around 100 million U.S. subscribers on ad-supported plans.
Notably, 65% of these ad-tier subscribers are completely new to the service, 23% are returning subscribers (“win-backs”), and 11% are existing users who switched from ad-free plans (“traders”).
2. Consumer Behavior & Ad-Tier Preference
Growing Adoption of Ad Tiers
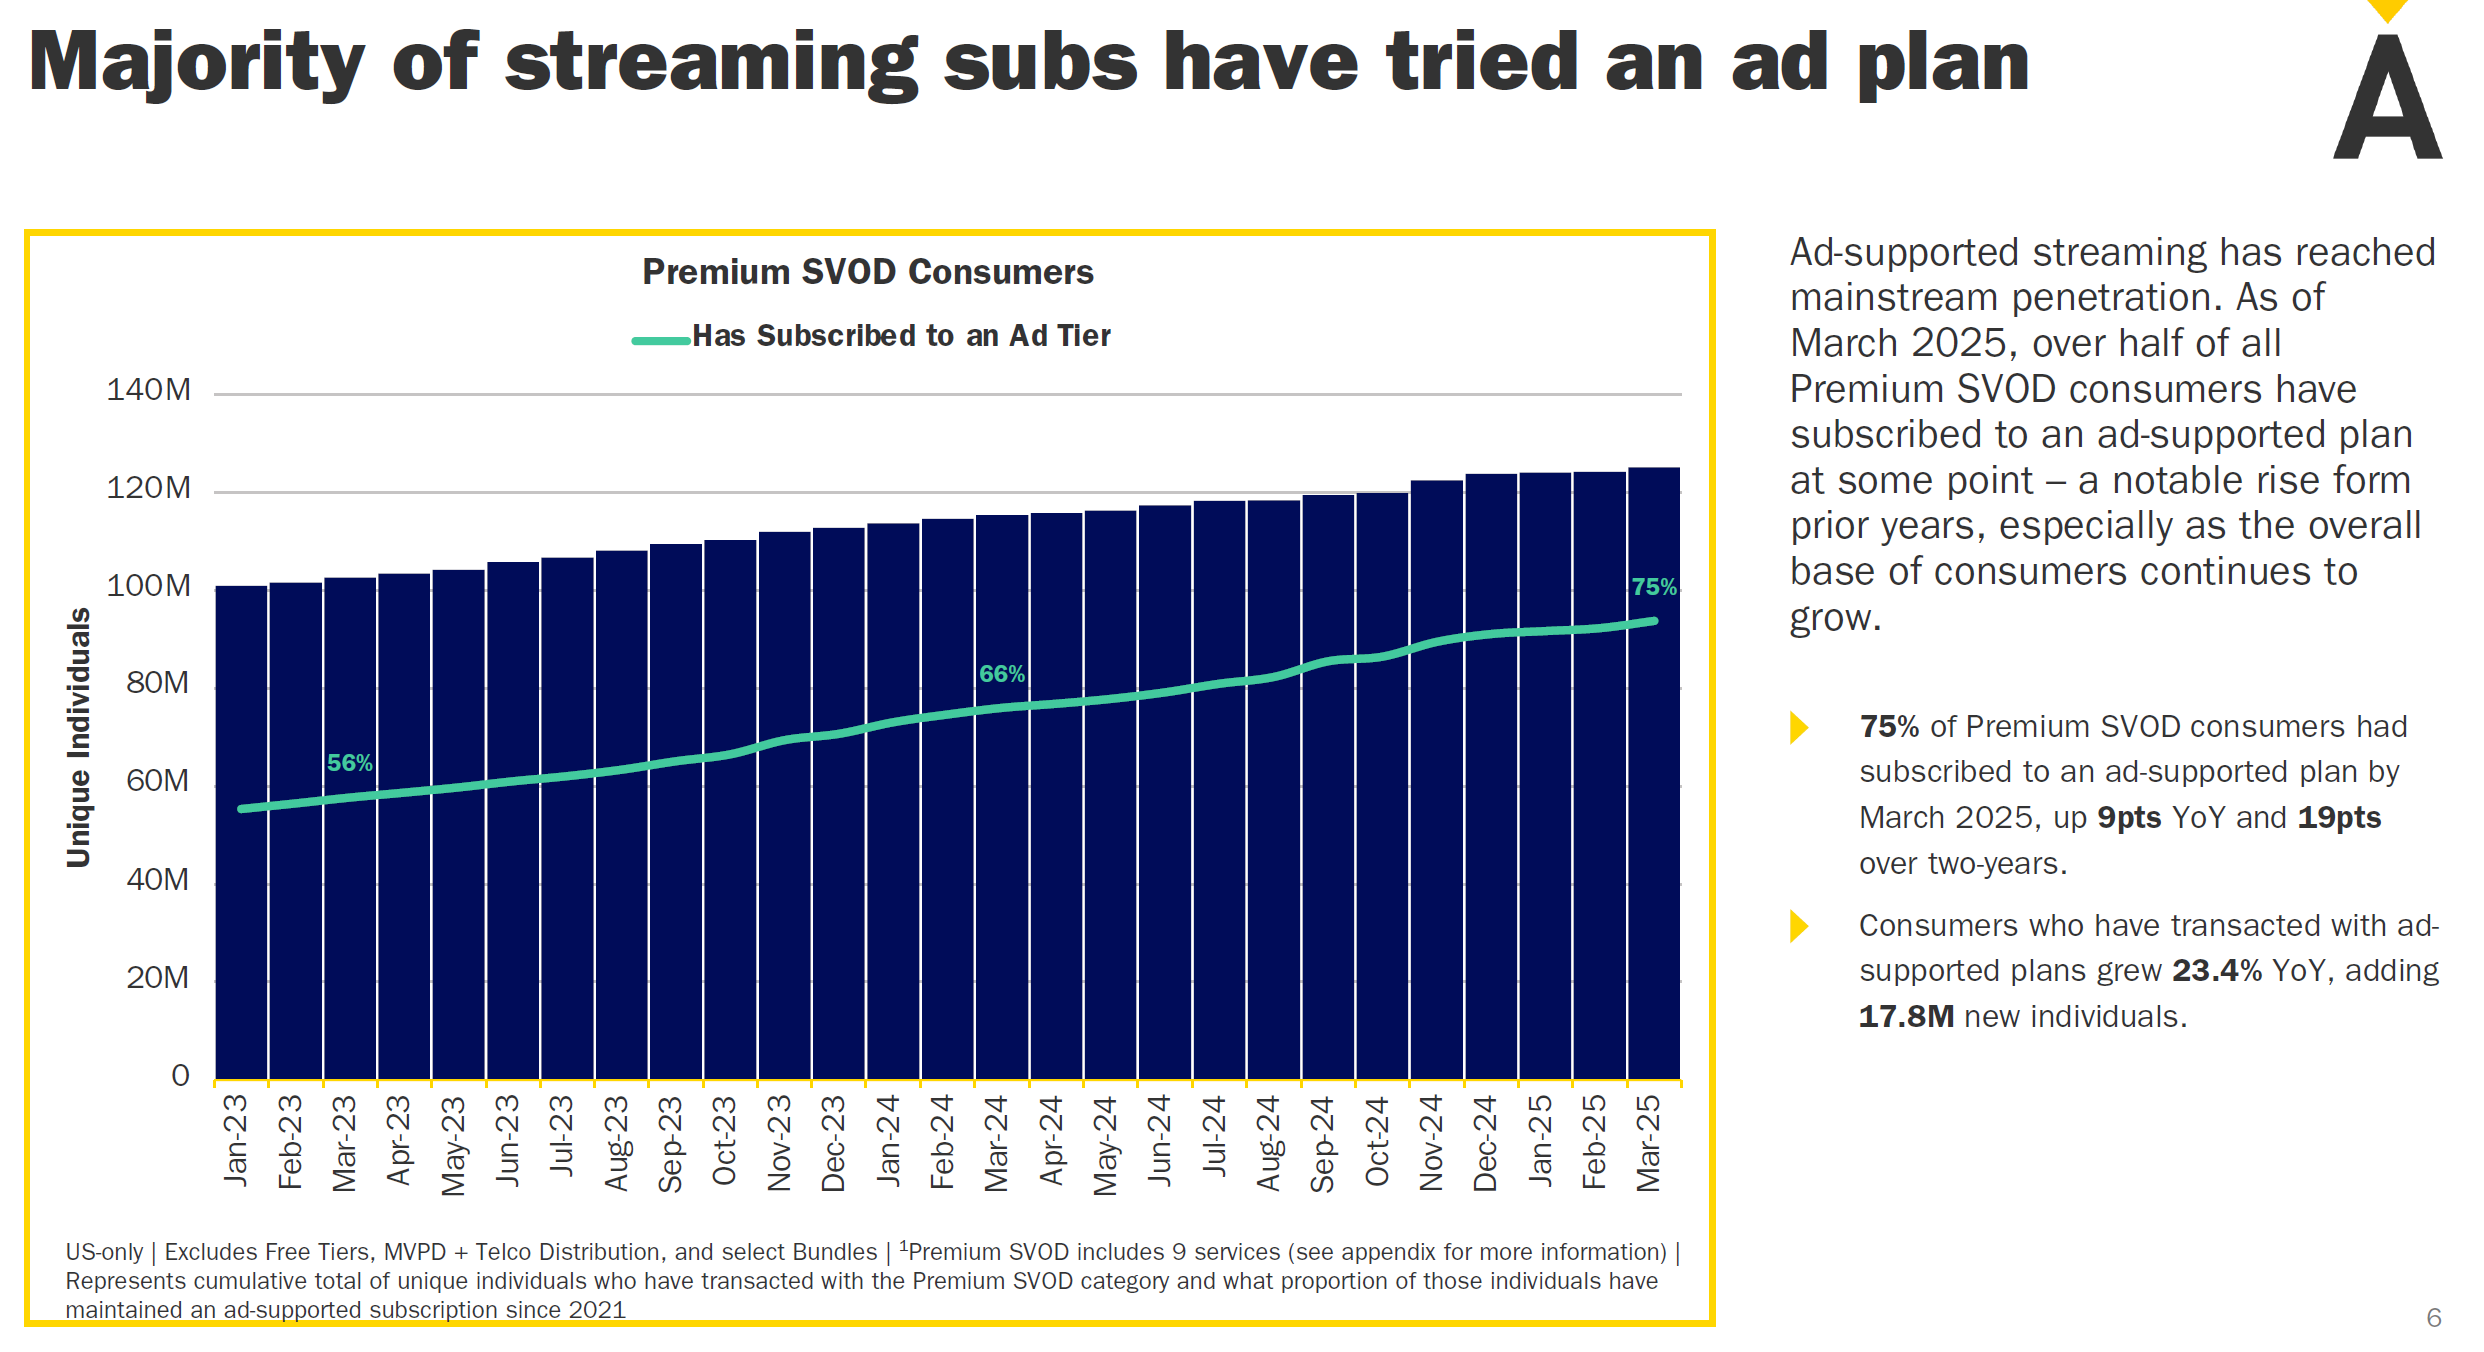
Seventy-five percent of all streaming subscribers have tried at least one ad-supported plan at some point—up from 66% in 2023. In 2024 alone, an additional 17.8 million people experienced an ad-supported tier.
Advertising Acceptance
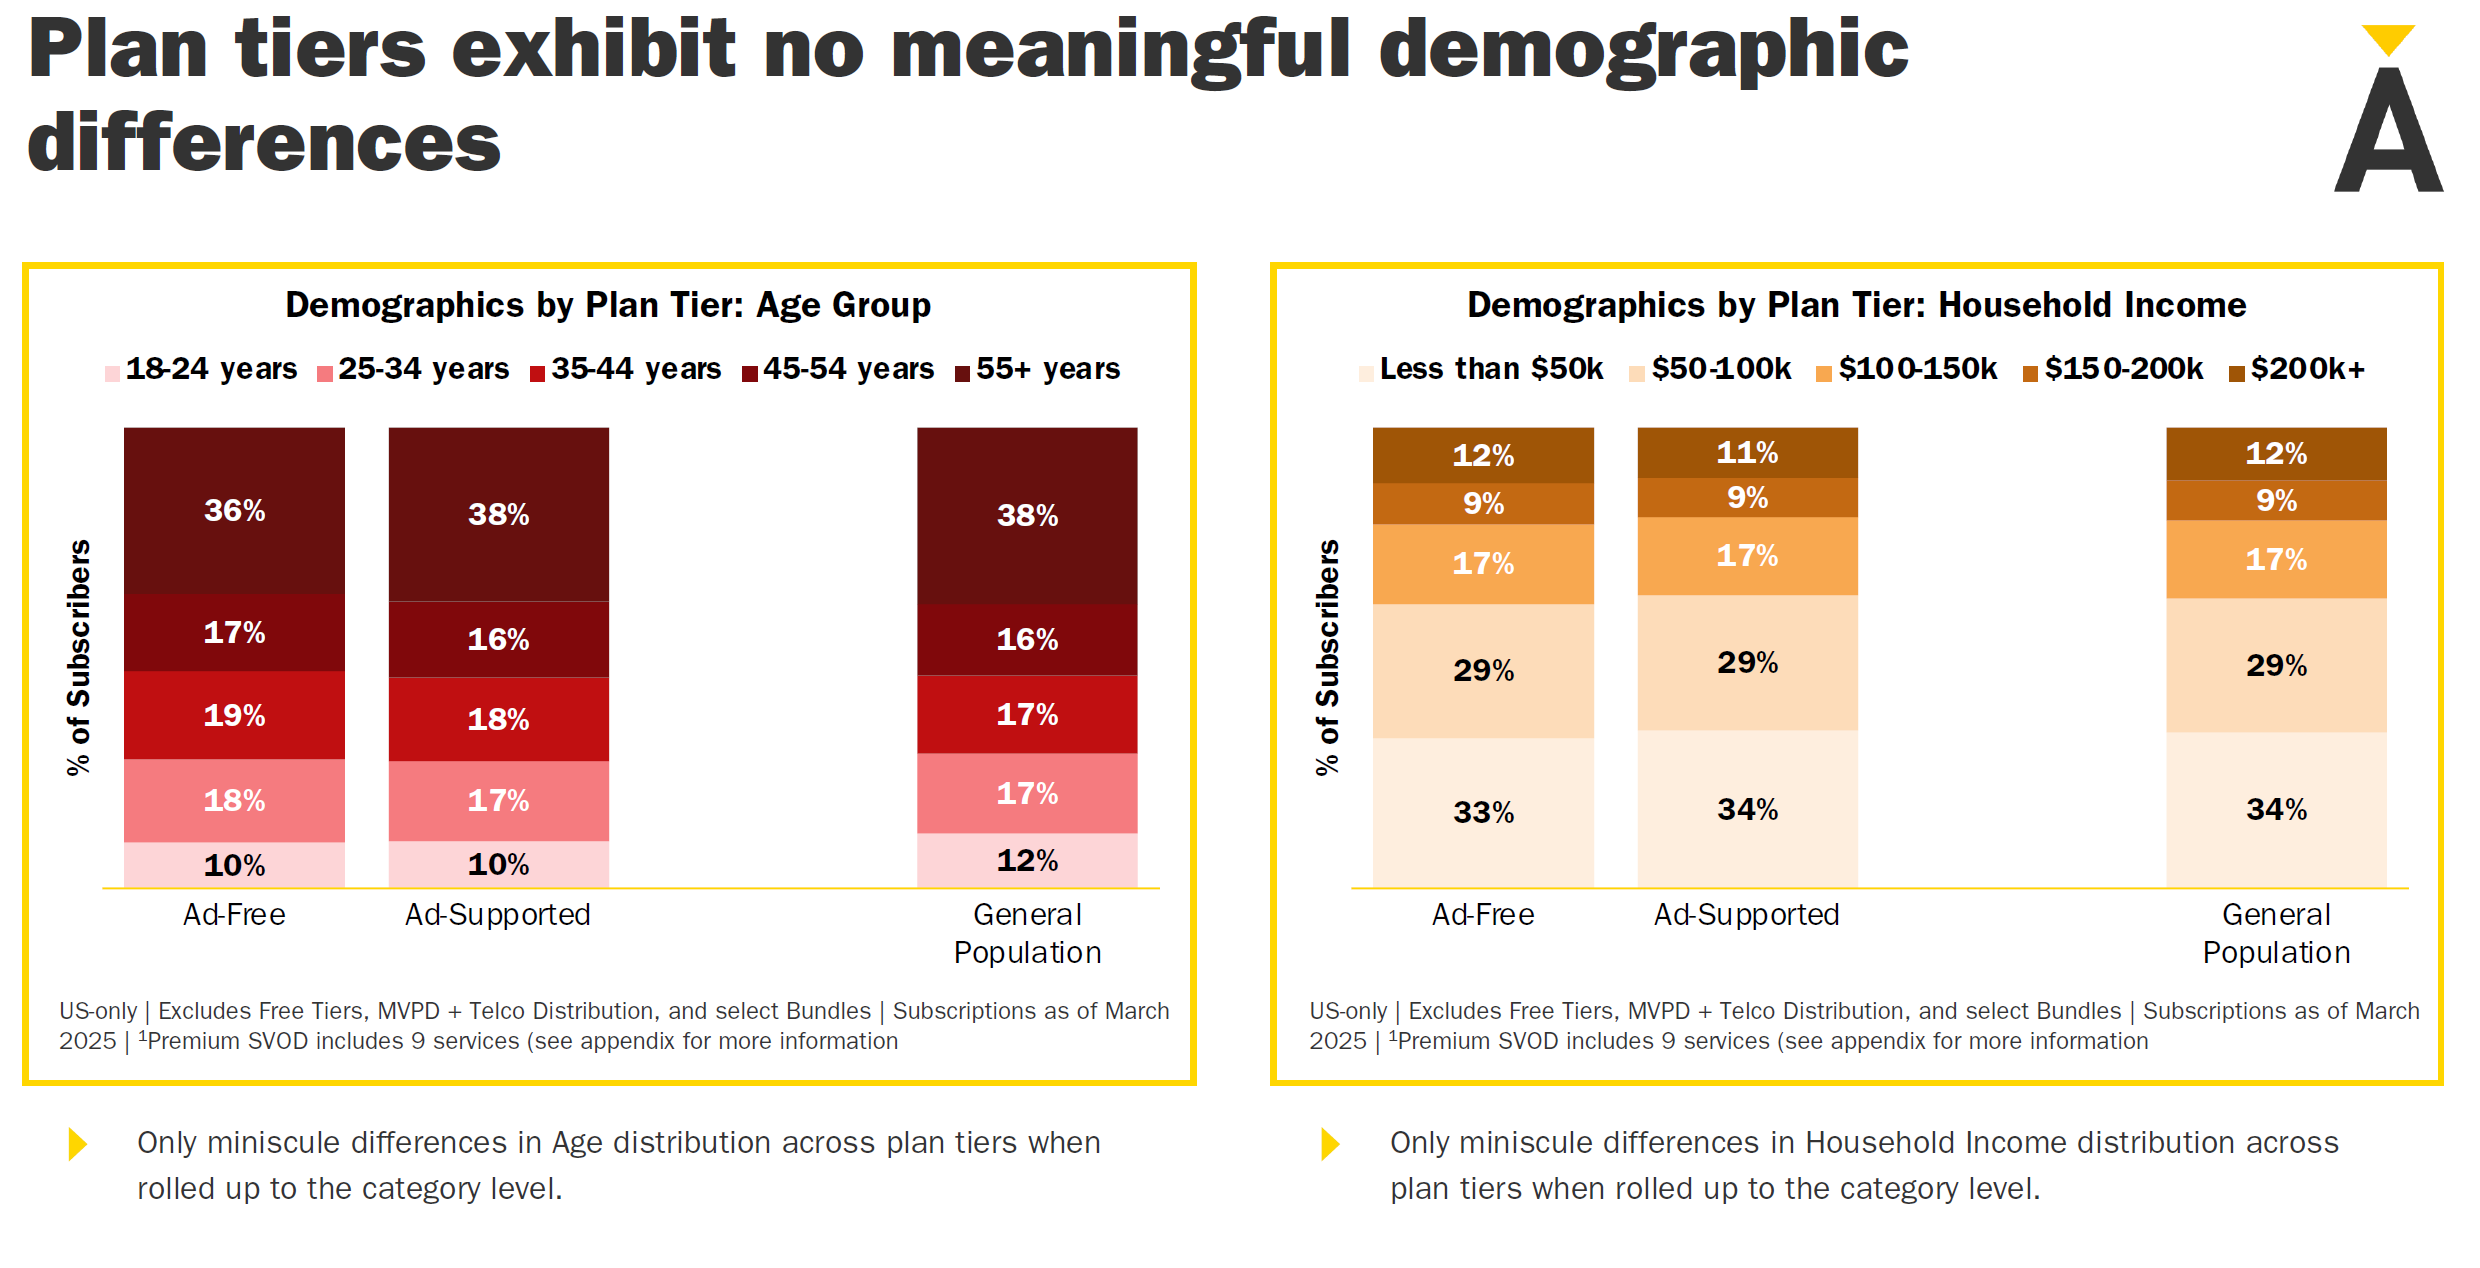
Among consumers who have tried at least two different ad-supported plans, 86% have accepted ads at some level. In other words, those who choose ad-supported plans (Ad-Supported) differ very little from those who choose ad-free plans (Ad-Free) in terms of age, income, or other demographic measures. There is no clear demographic line separating these two groups.
3. Shifting Subscriber Behavior Around Ads
By 2025, U.S. streaming subscribers no longer think of advertising in a strictly binary way (ad vs. no ad). Instead, many switch between ad-supported and ad-free tiers based on price, content, and personal circumstances. This emergent “Ad Manager” behavior provides streaming providers with an opportunity to diversify revenue streams by offering multiple price points, bundles, and product strategies.
Ad Management Has Become the Dominant Behavior
Streaming subscribers’ approach to ad tiers is changing fast. The number of “ad-managing” users—those who adopt or drop ad tiers flexibly—now represents the largest portion of the market.
Ad-Choice Segmentation (2023-2025)
Research firm Antenna classifies U.S. premium SVOD subscribers into four groups based on how they handle ad-supported plans:
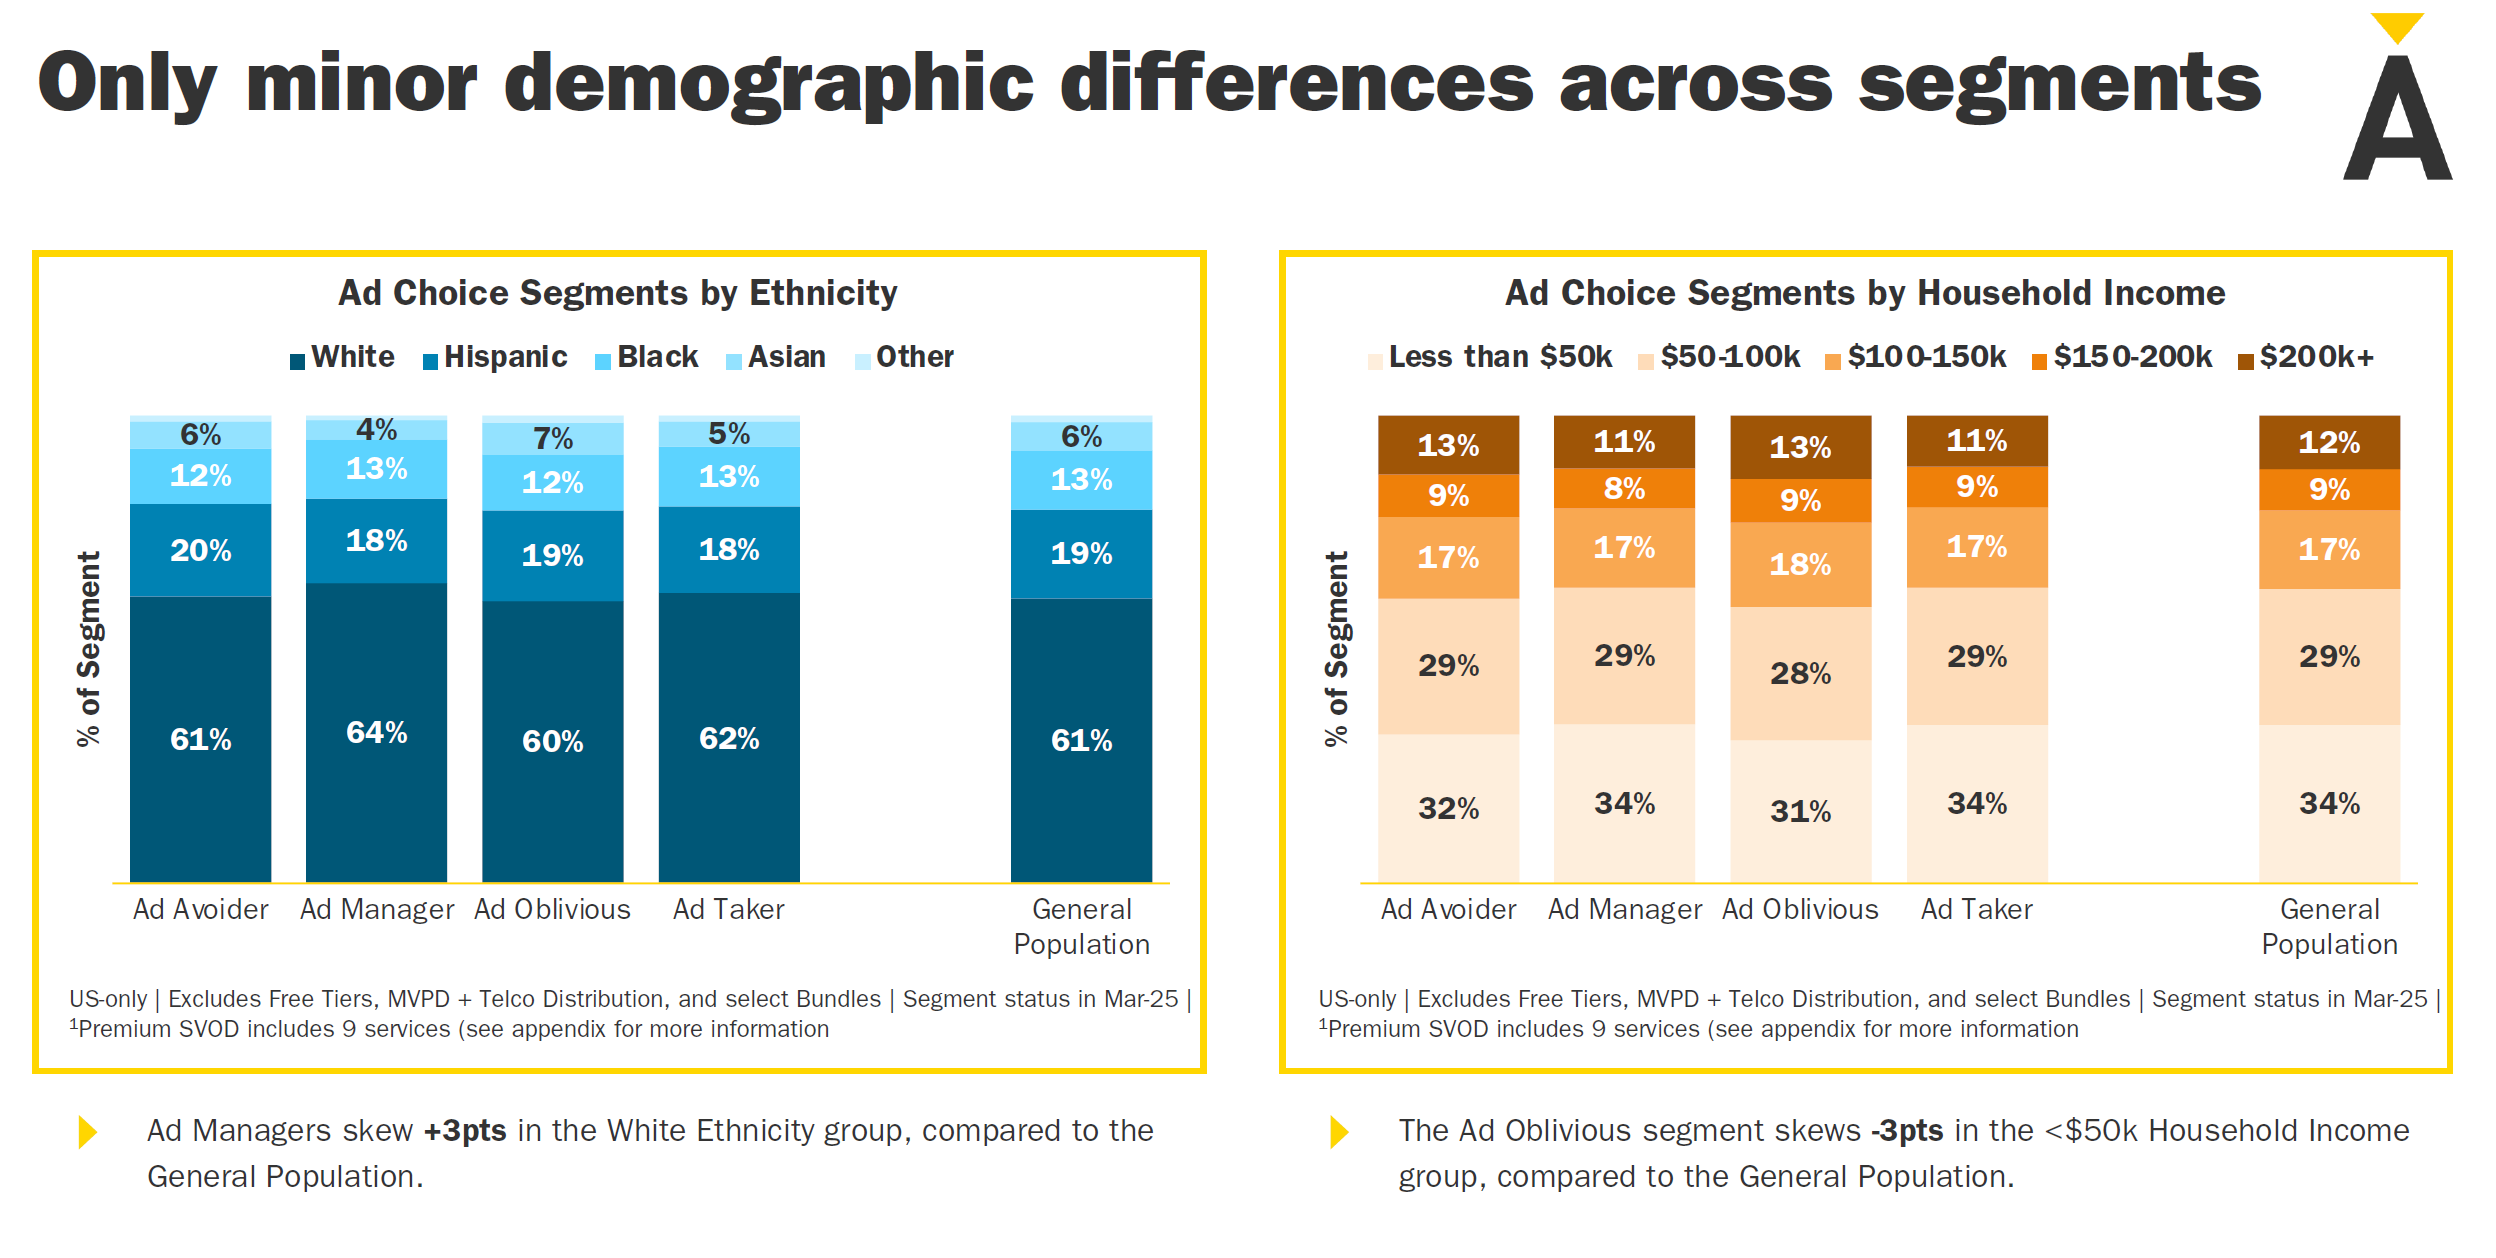
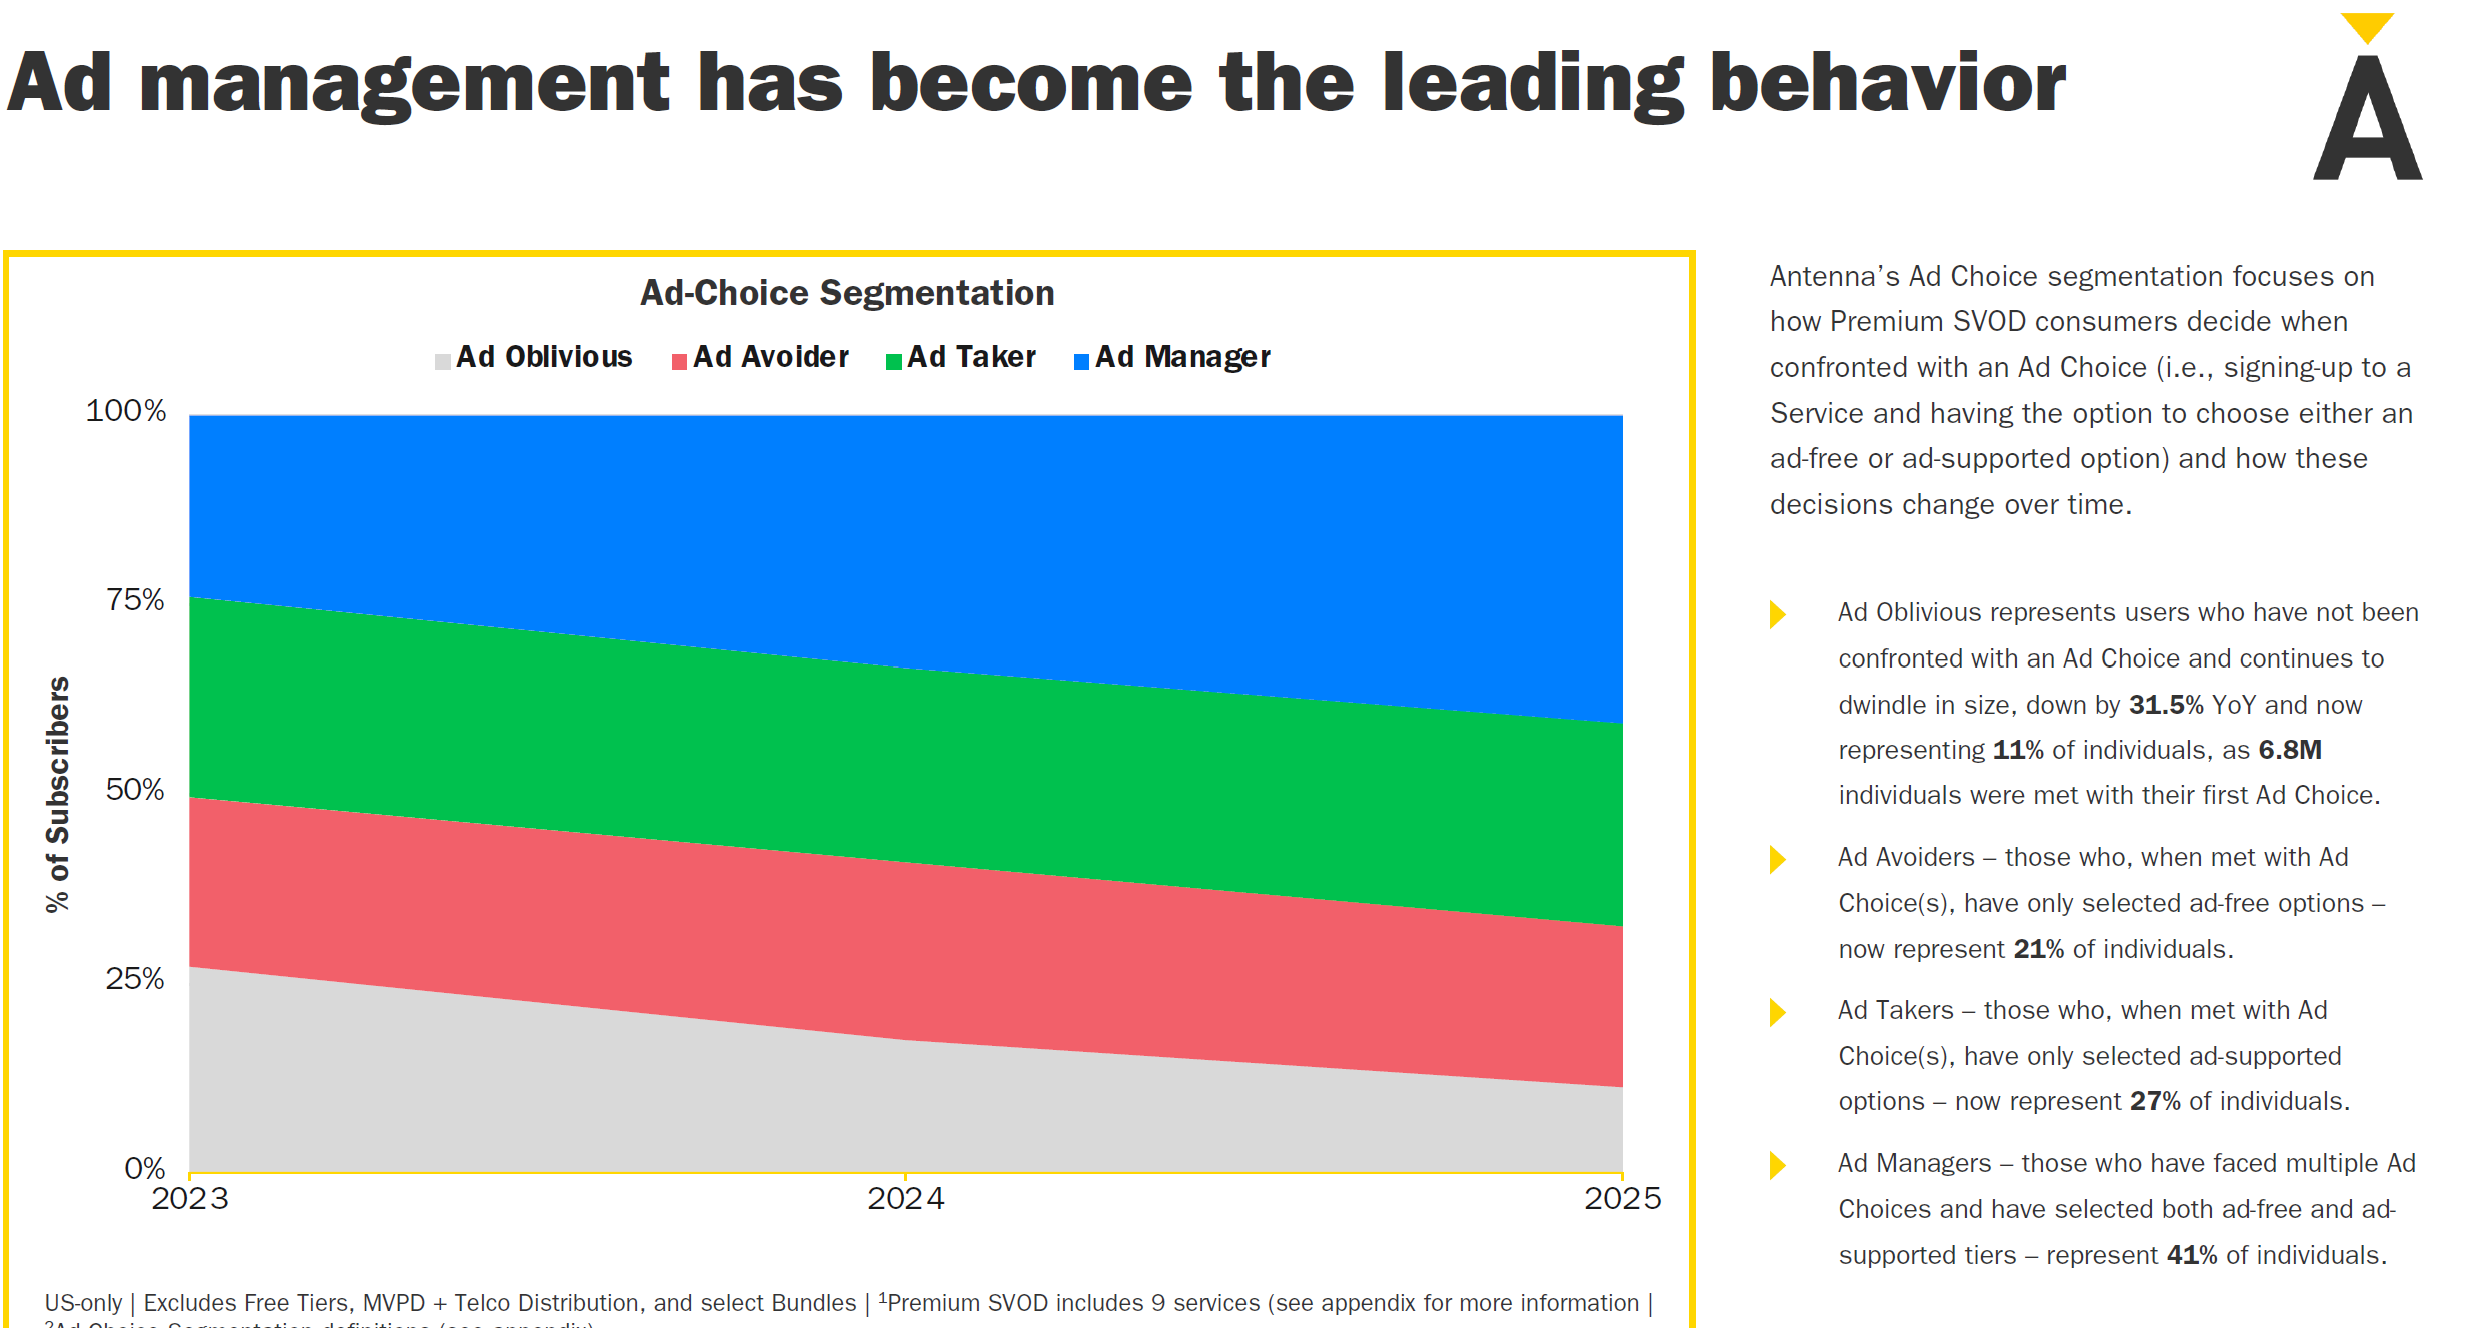
Ad Oblivious (gray): Those who have never used an ad-supported tier. This group is now just 11% of total subscribers, down significantly over the last year as 6.8 million people tried ad-supported tiers for the first time.
Ad Avoider (red): Those who consistently opt for ad-free only, down to 21%.
Ad Taker (green): Those who exclusively use ad-supported plans, now at 27% and growing.
Ad Manager (blue): Those who have tried both and switch back and forth depending on price, content, or other factors. At 41%, they form the largest segment and are rapidly becoming the mainstream consumer behavior.
Key Observations
Mainstreaming of Ad Experience: The shrinking of the Ad Oblivious group indicates the widespread acceptance or at least trial of ad-supported tiers.
Flexible Consumer Behavior: At 41%, the Ad Manager group signals a move away from one-size-fits-all models, pushing streaming providers to offer varied plans to meet different viewer needs.
Ad-Friendly Growth: Even the Ad Taker segment (ads only) continues to grow, suggesting reduced resistance to ads and a preference for lower price points.
Declining Hardline Ad Avoiders: The Ad Avoider group is down to 21%, suggesting fewer subscribers are staunchly opposed to seeing any ads.
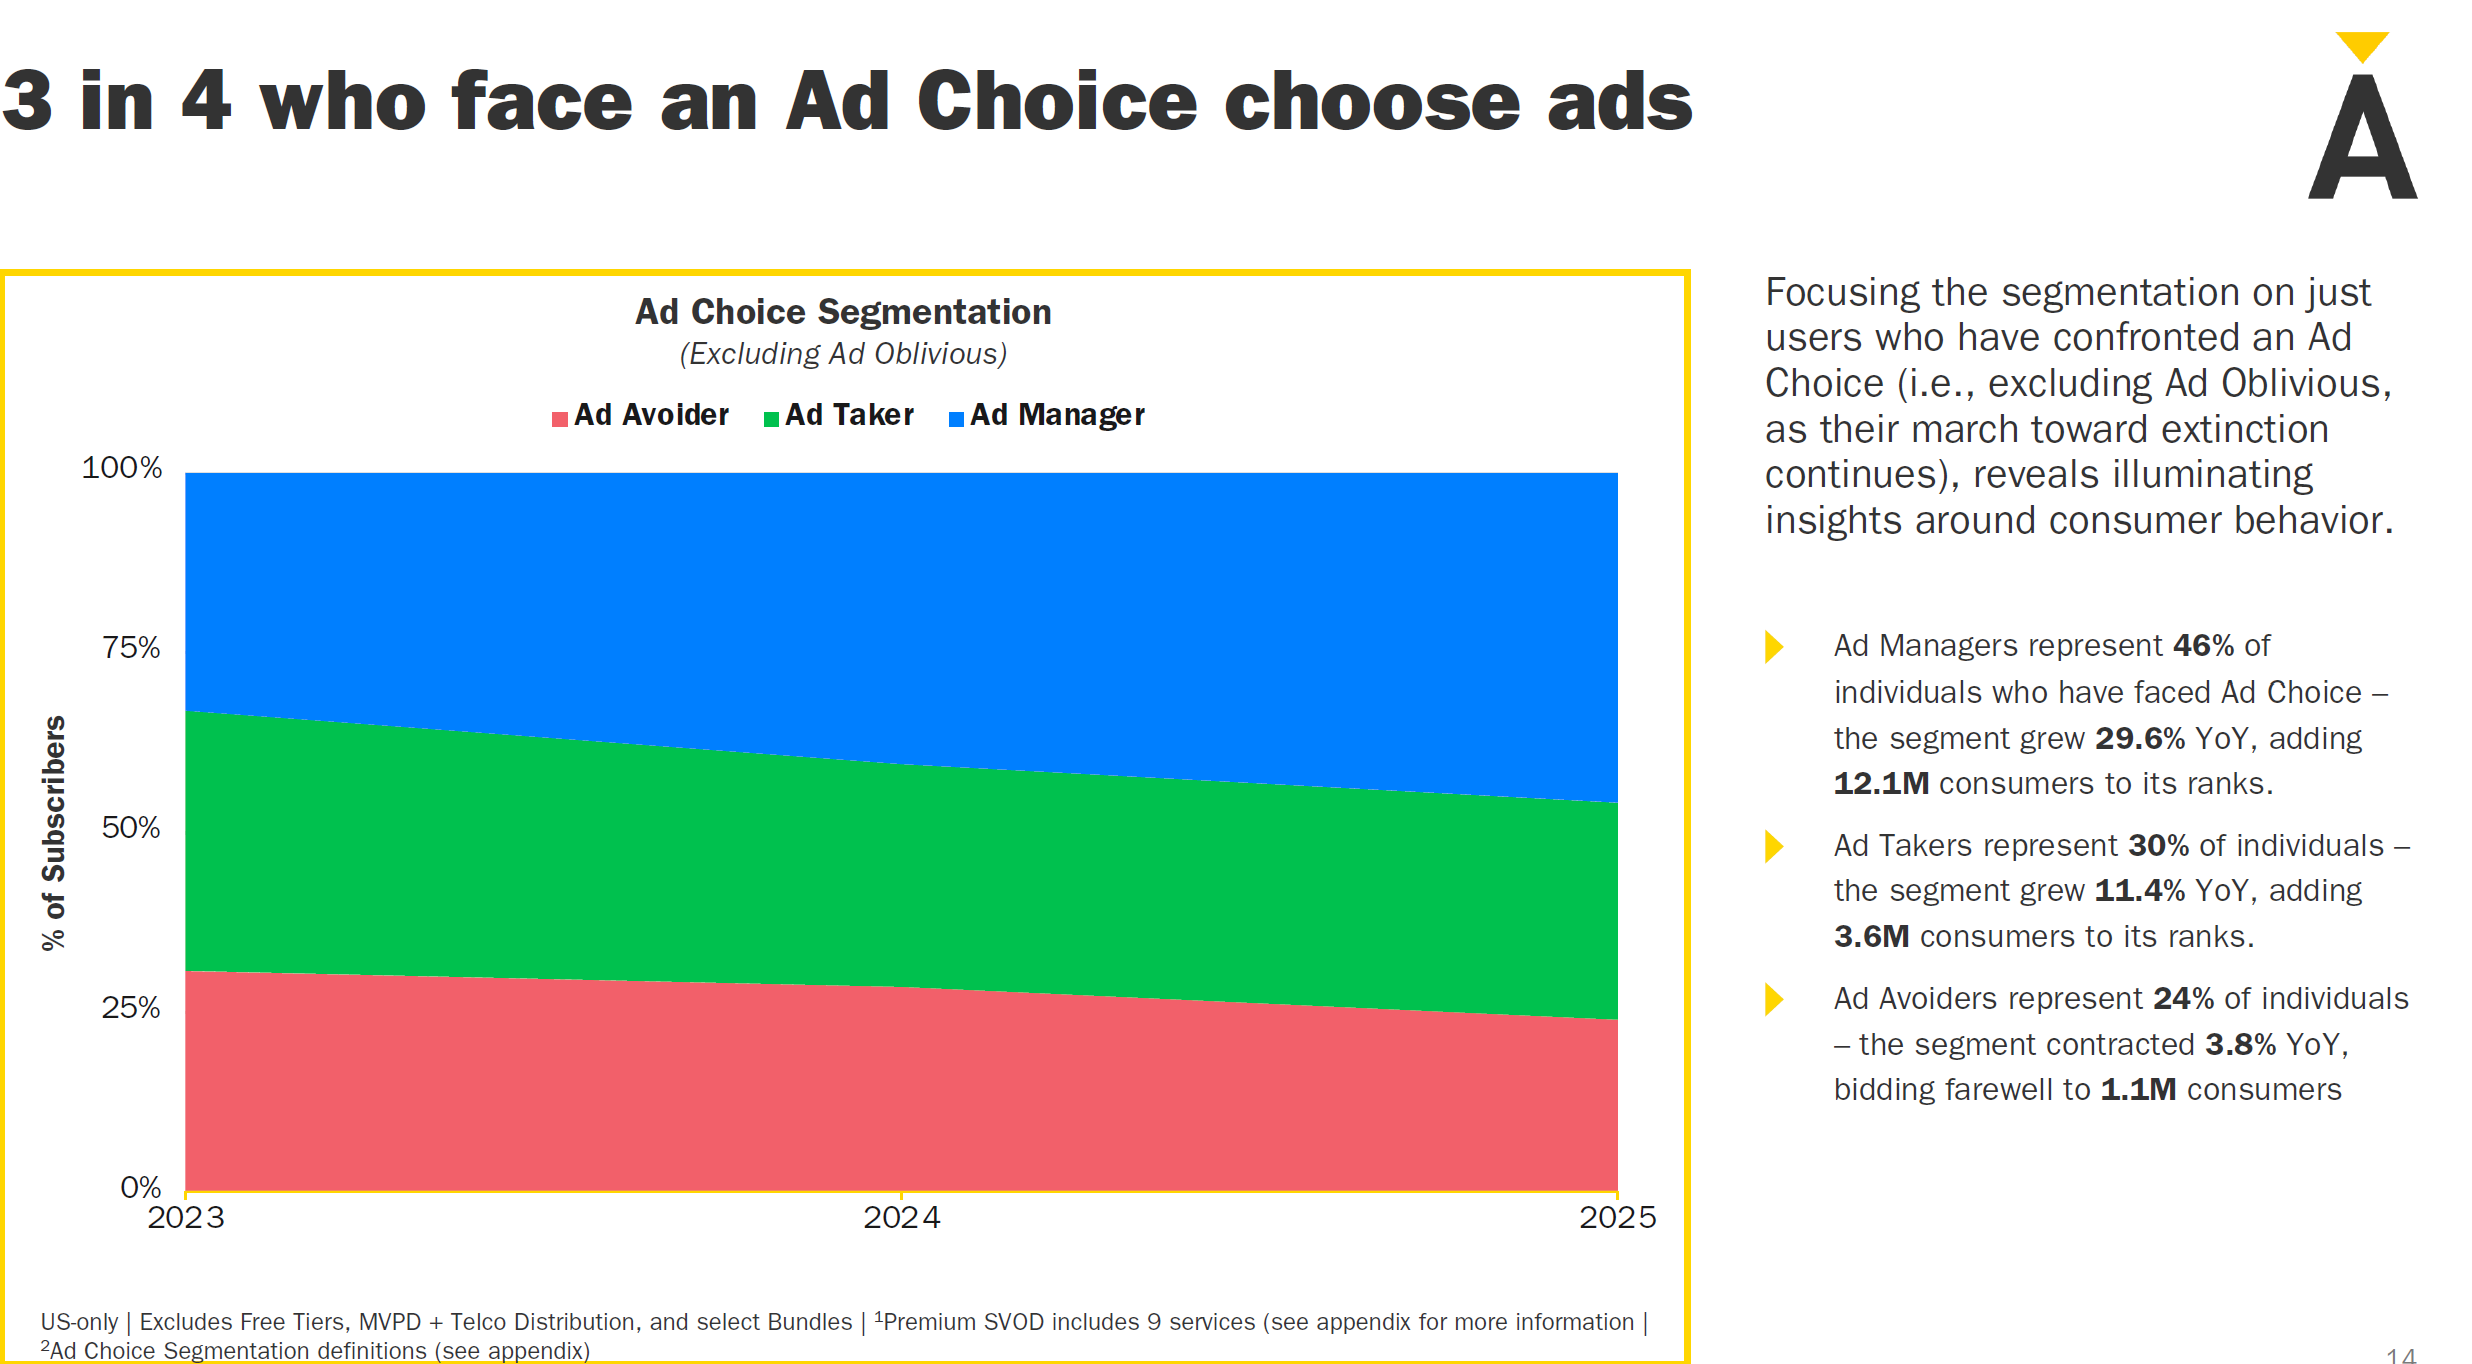
4 in 5 Who Face an Ad Choice Accept Ads: As of 2025, among those who have encountered ad-supported options, 76% either embrace ads entirely or are flexible about them.
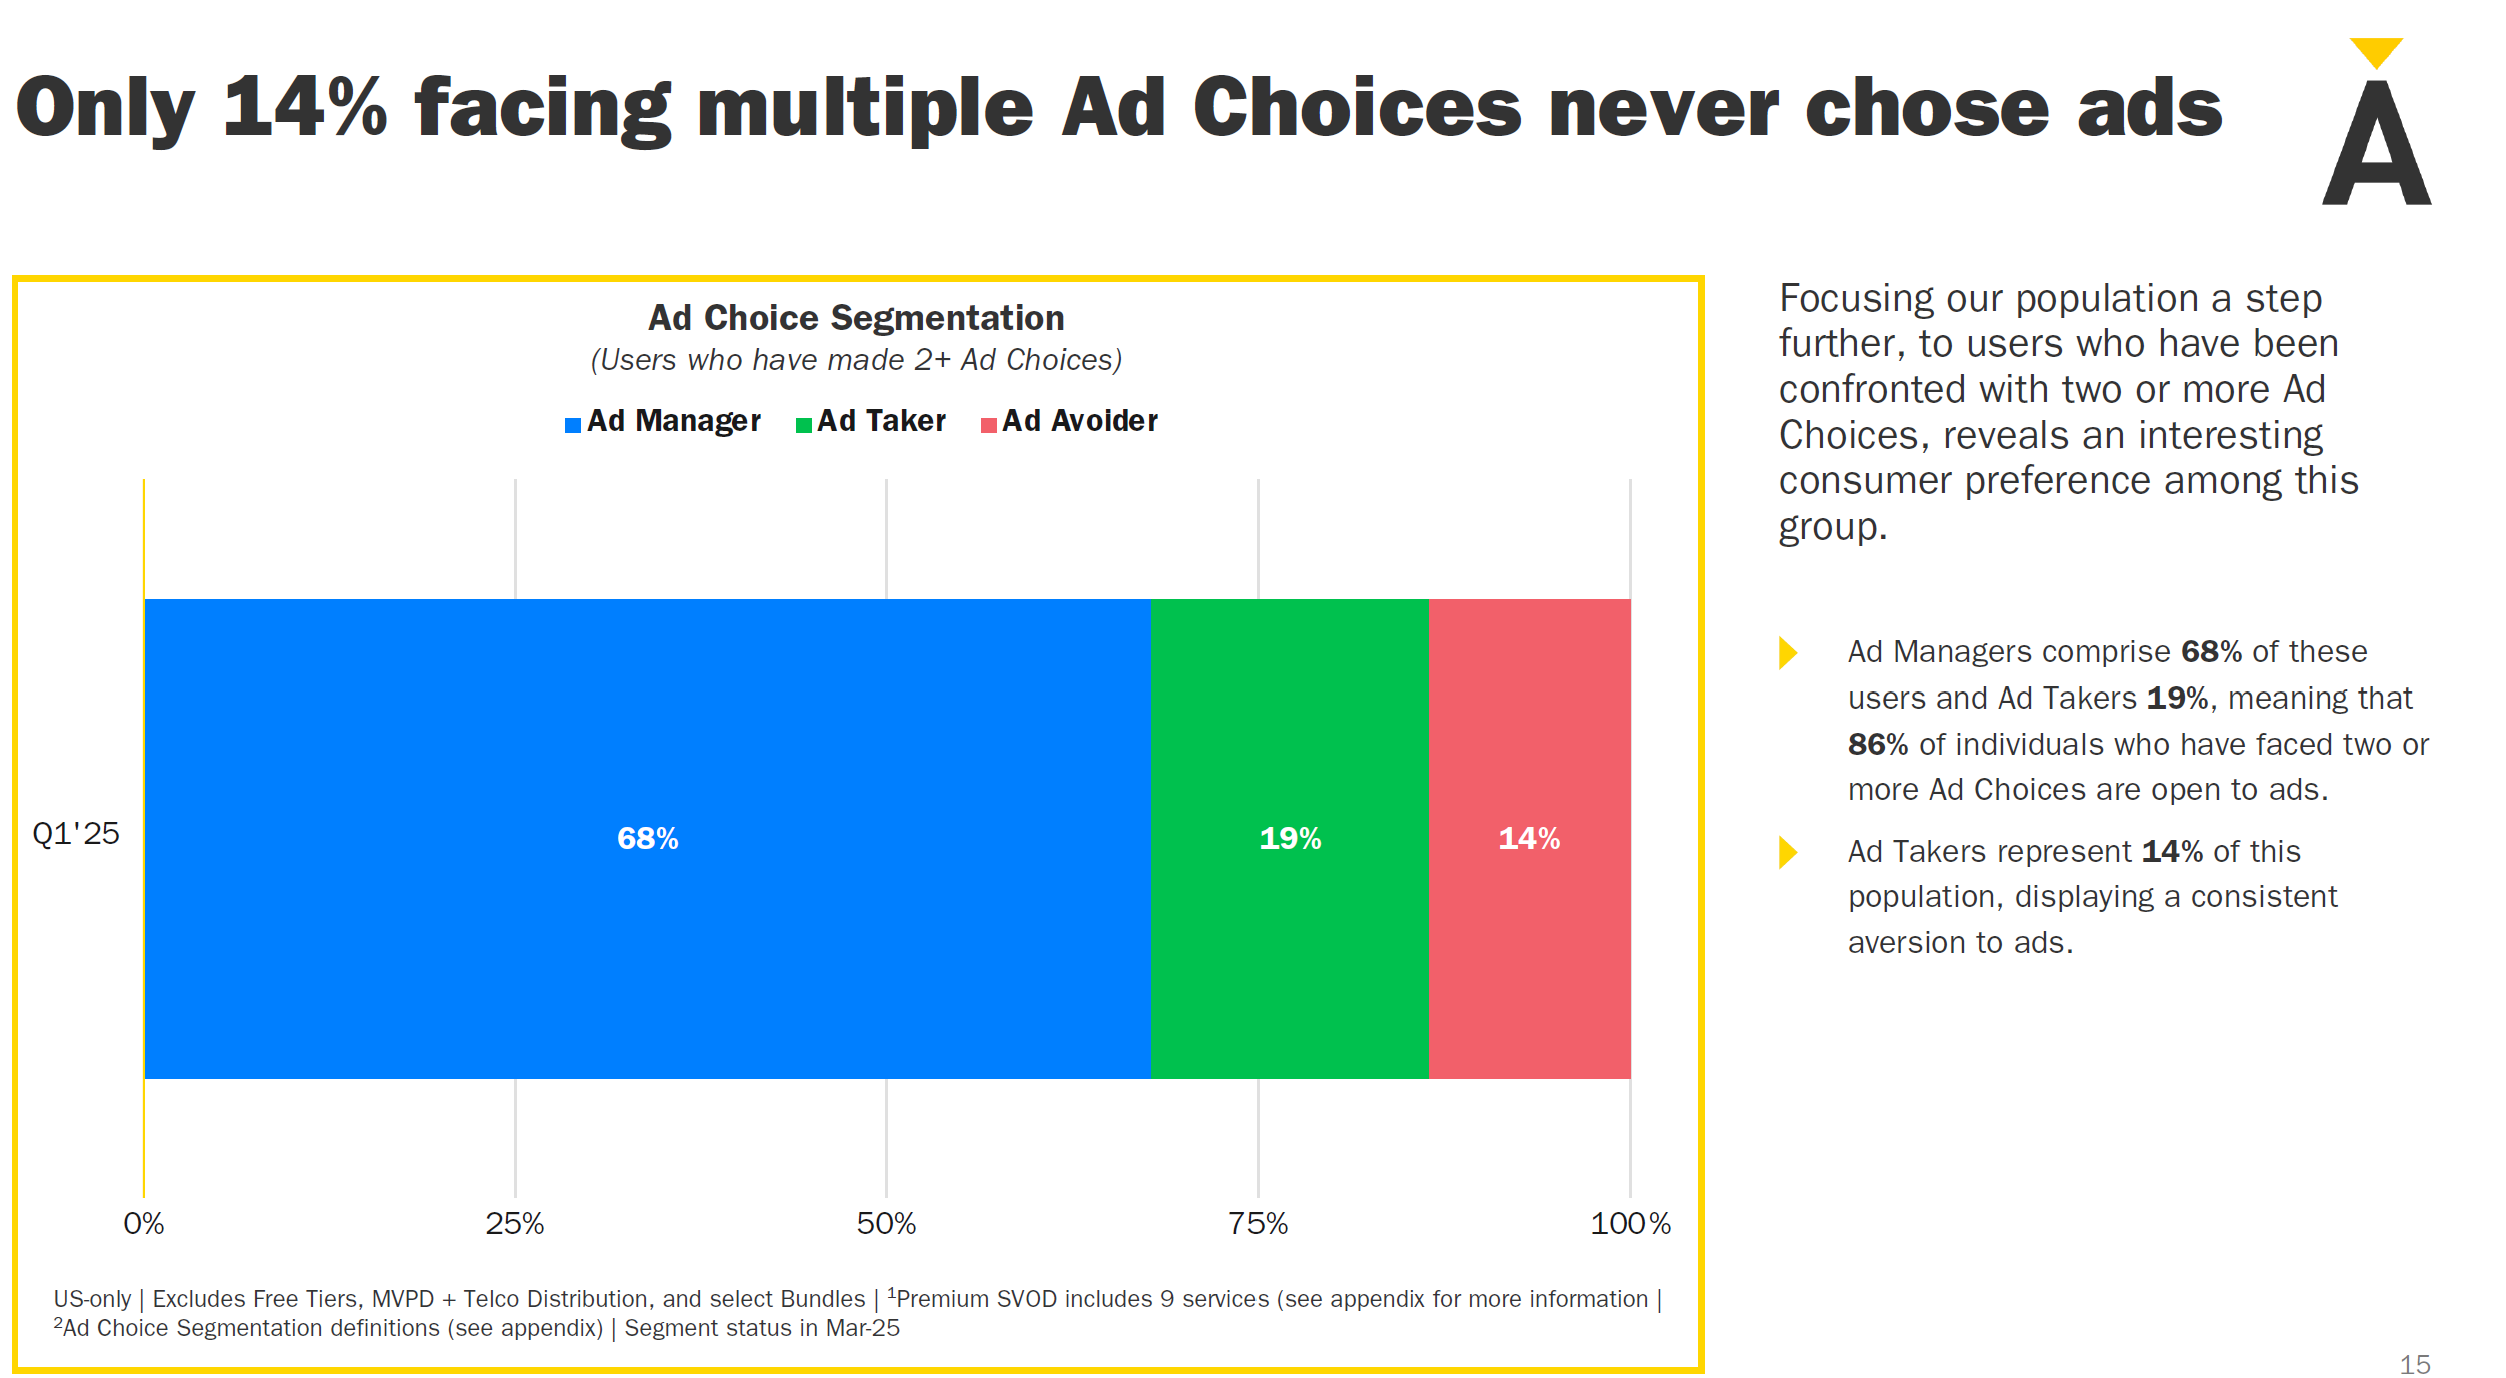
Just 14% Never Watch Ads: Of those with two or more ad-tier experiences, 86% say they accept ads at least occasionally, leaving only 14% as consistent ad rejectors.
4. Loyalty and Churn Analysis
Differences in Churn Rates
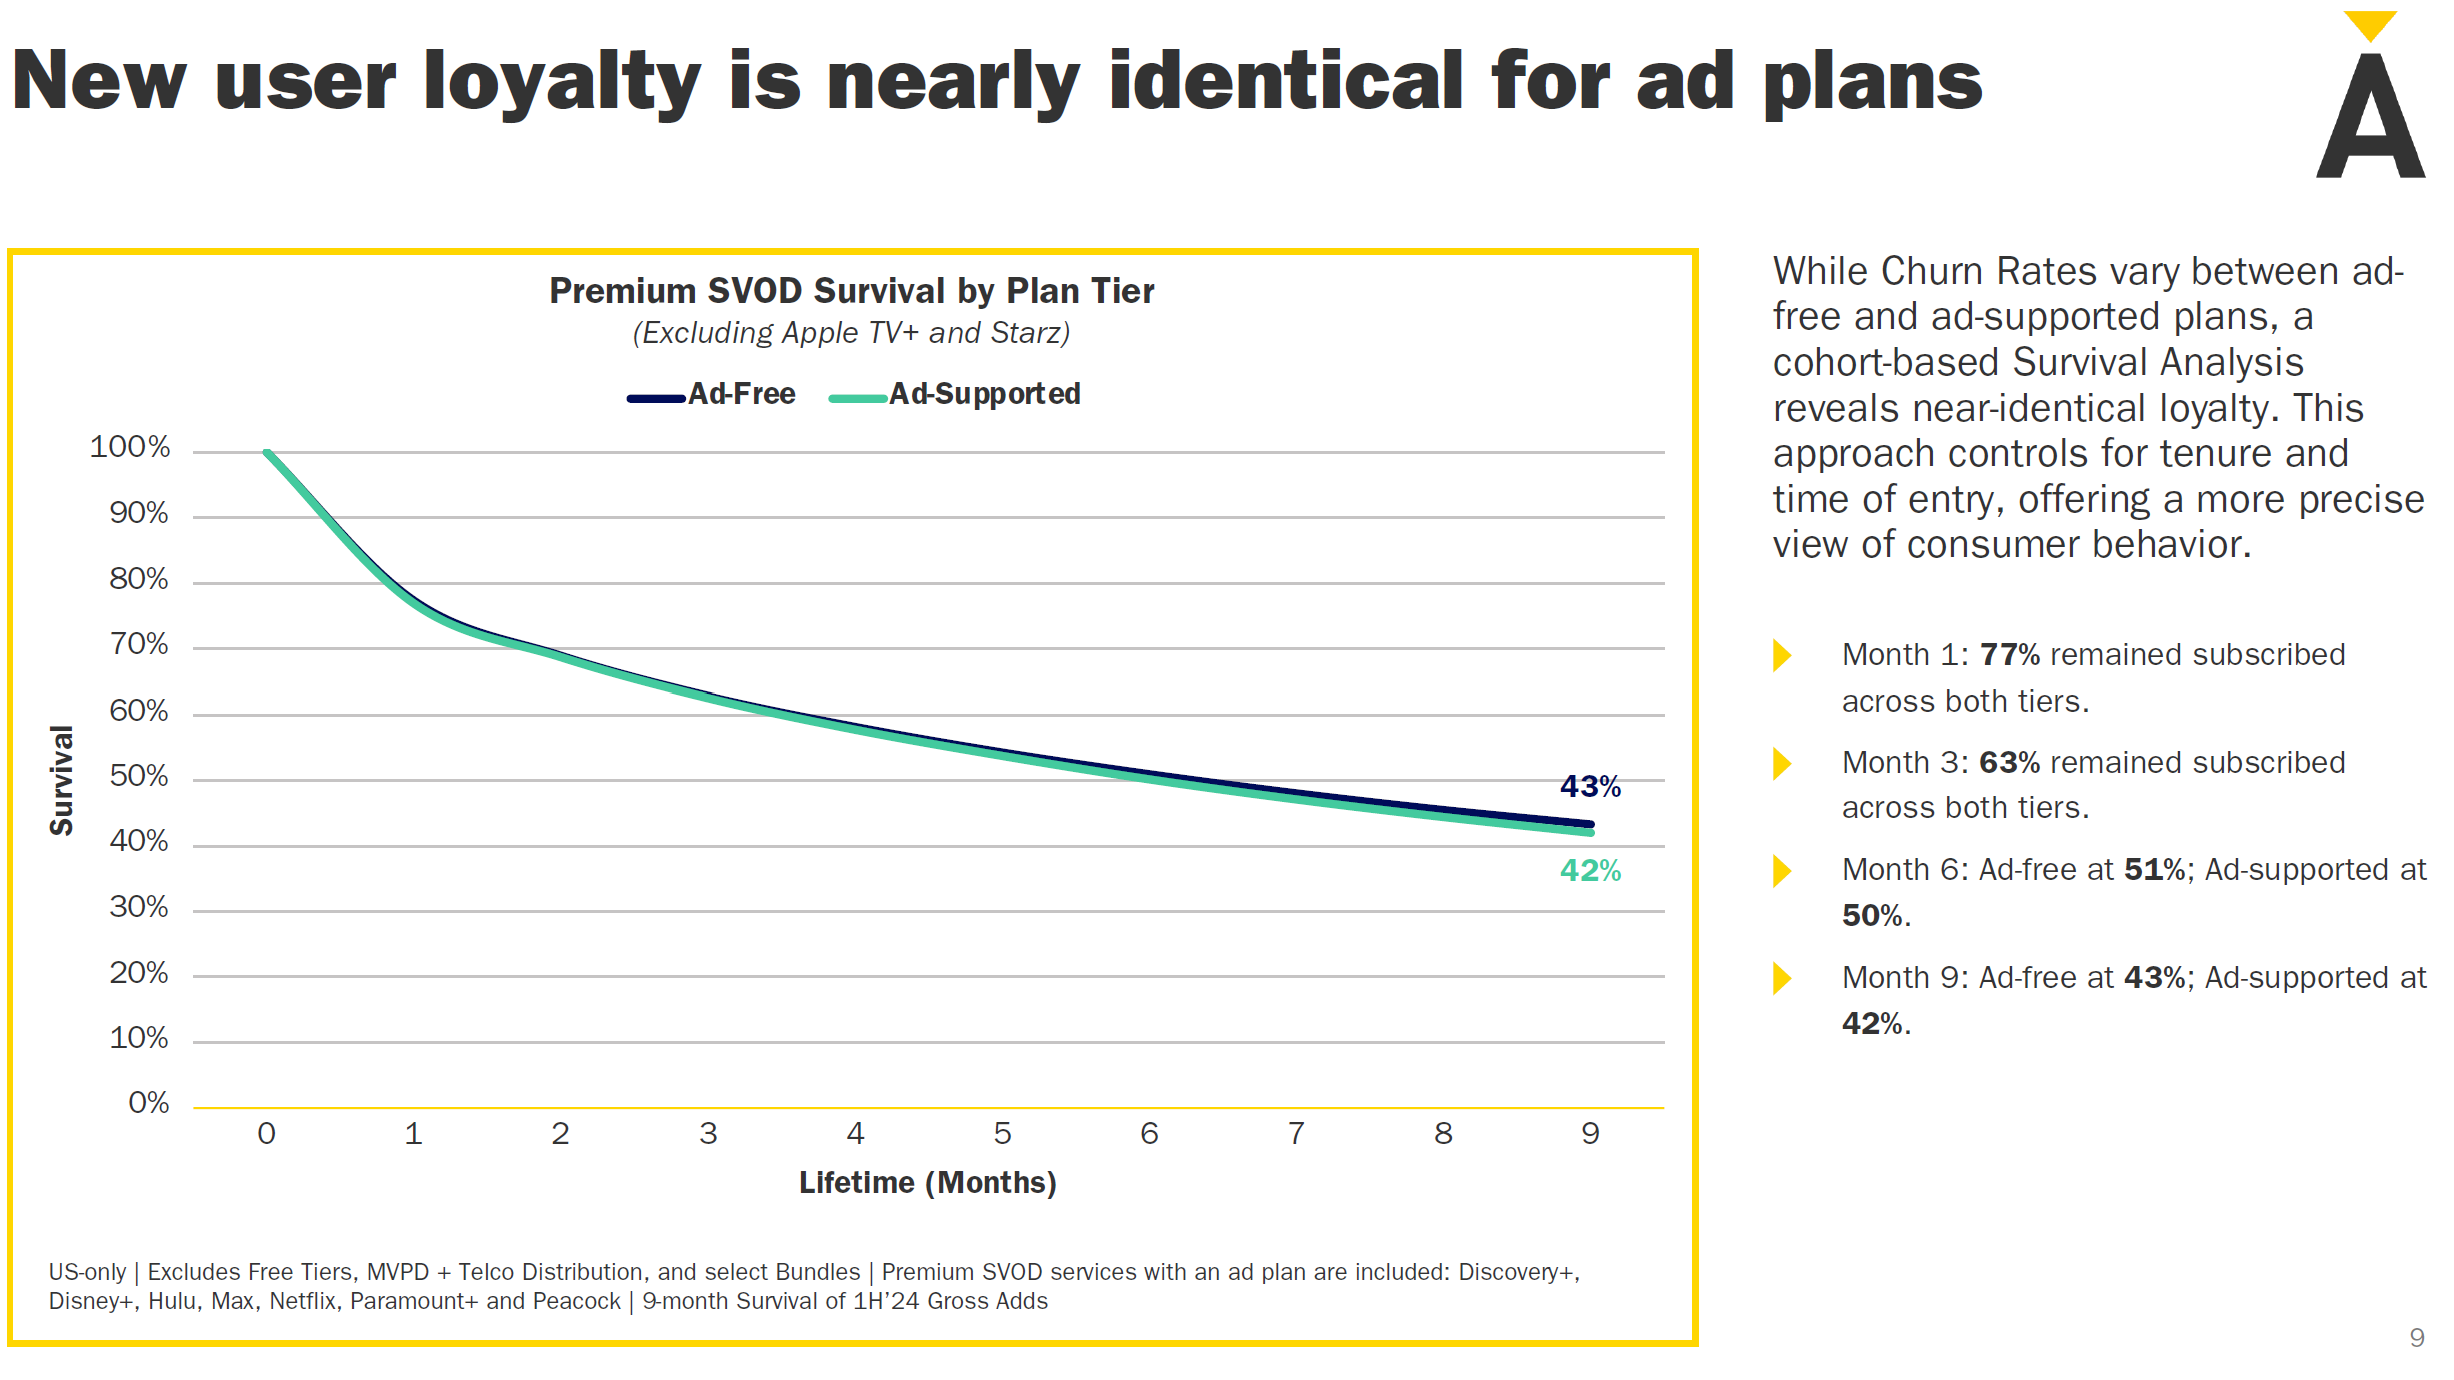
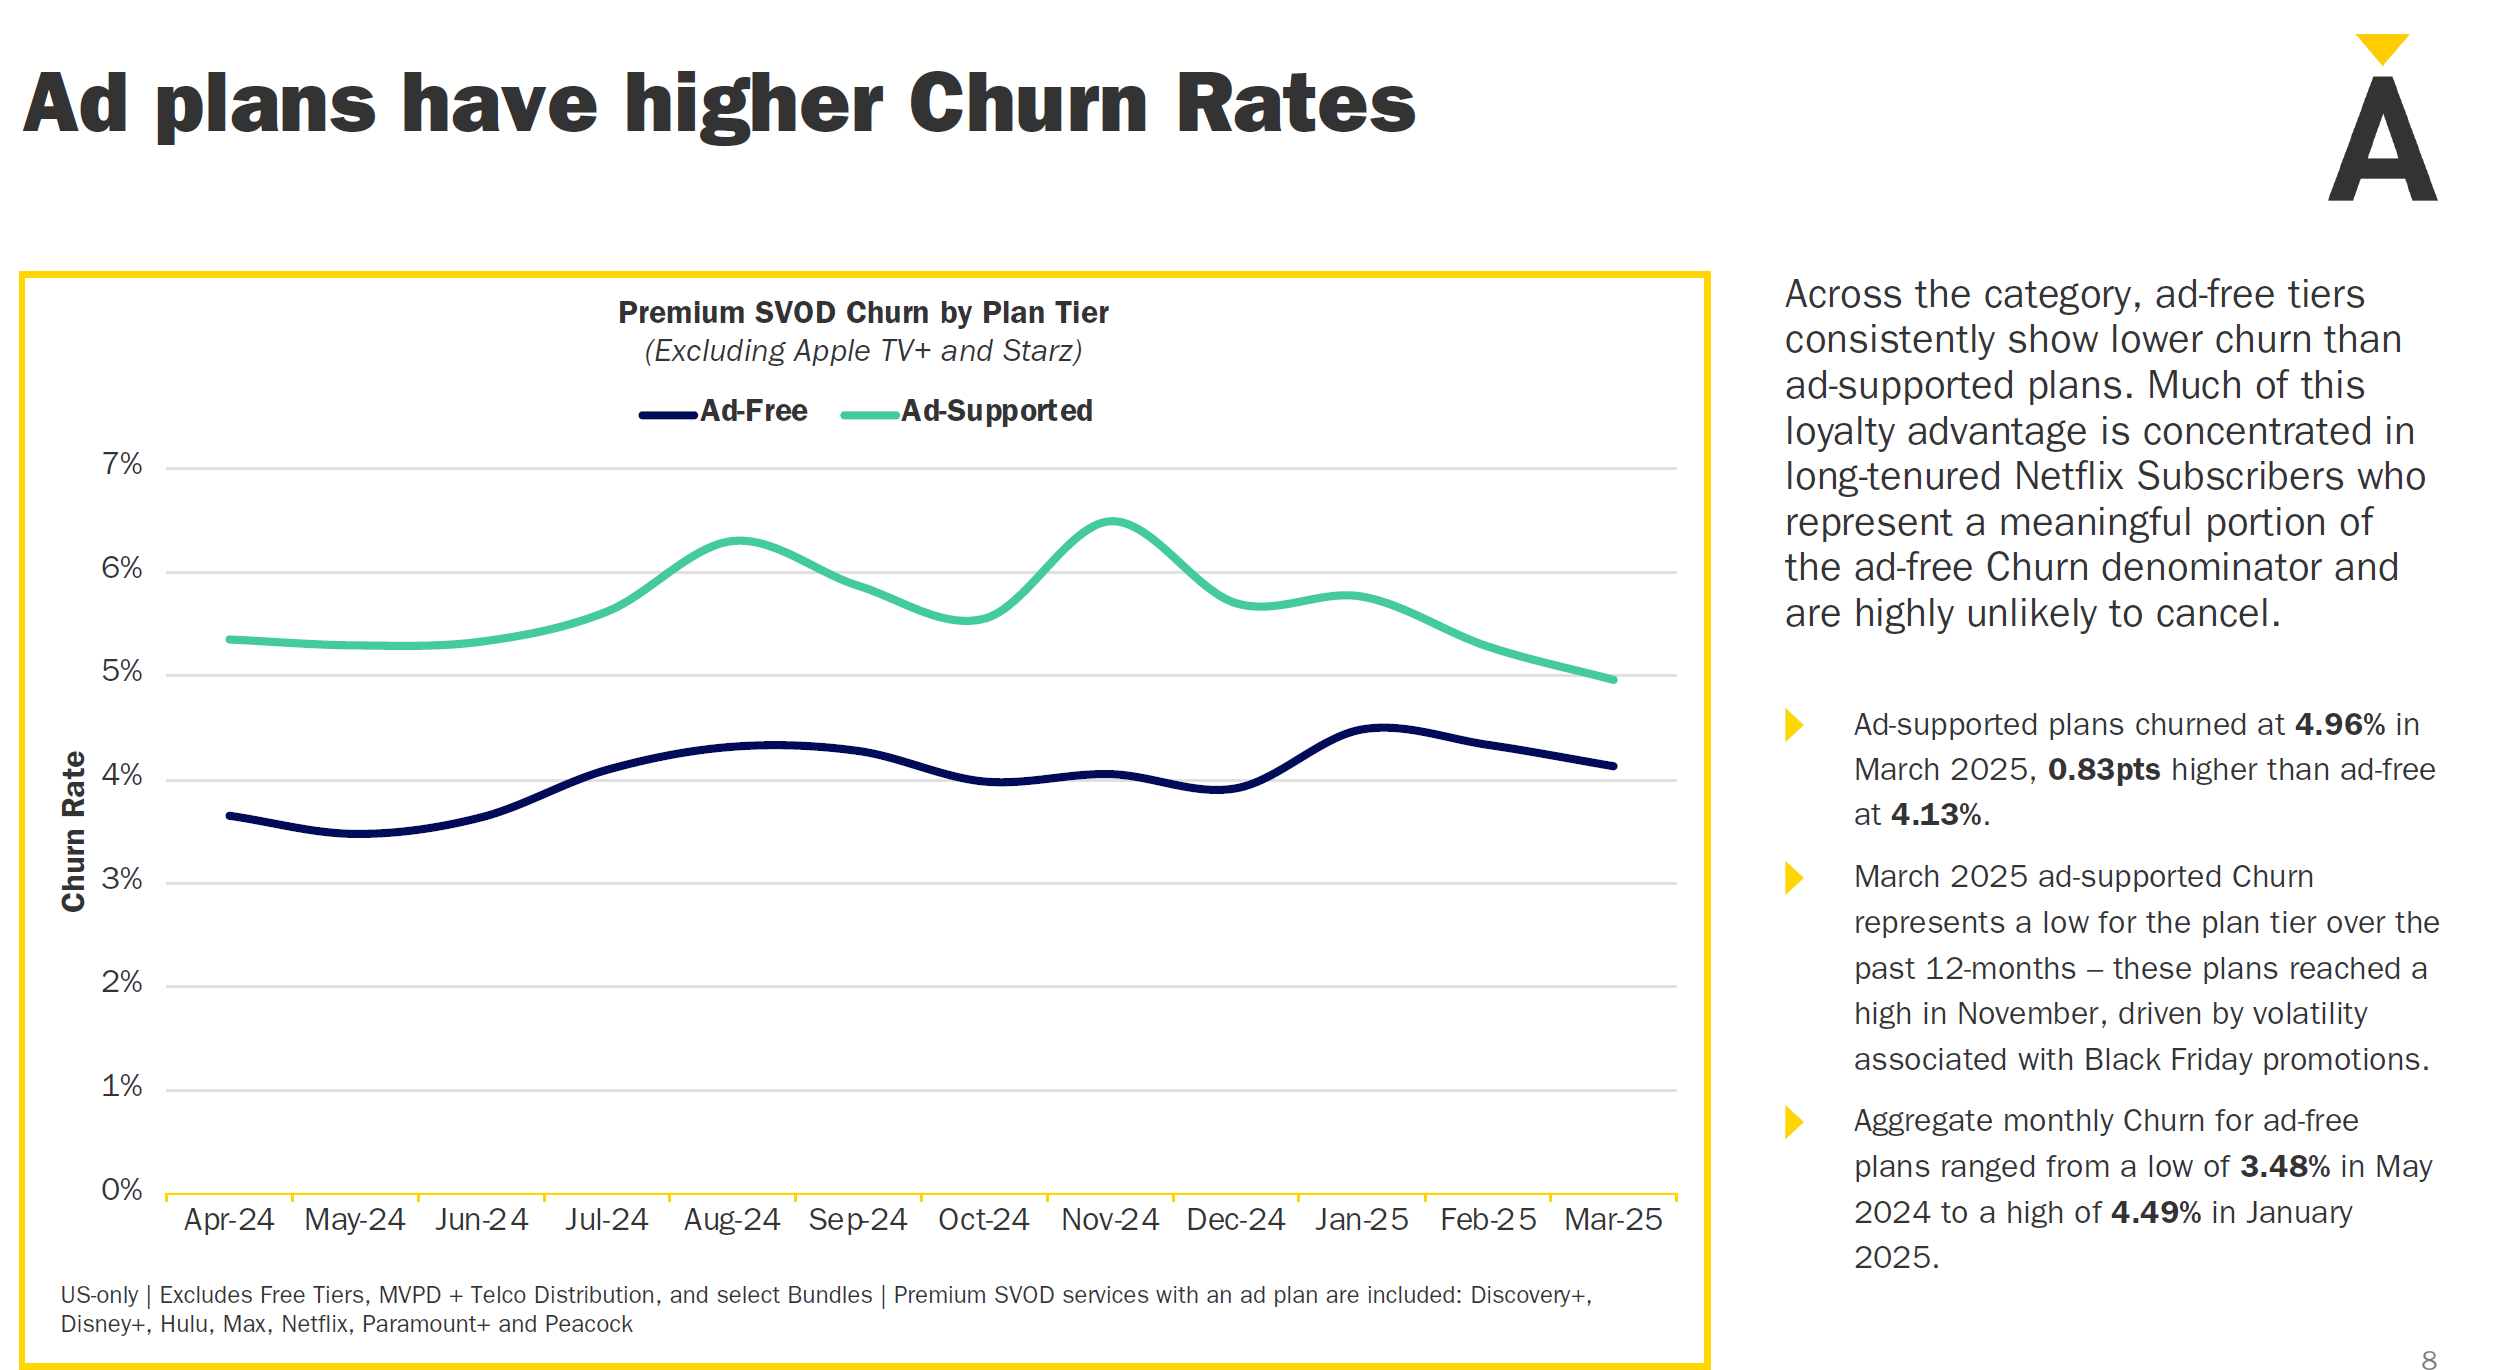
As of March 2025, the monthly churn rate for ad-free tiers (4.13%) is slightly lower than for ad-supported tiers (4.96%). However, after nine months, the retention (survival) rates for both plans are similar—43% for ad-free versus 42% for ad-supported—indicating no major loyalty gap in the long run.
Ad-supported plans have a higher churn rate, potentially due to annoyance with commercials.
Ad-free plans generally enjoy lower churn, helped by a loyal user base.
Long-Term Subscriber Effect
The disparity in churn rates is partly tied to a small but devoted group of long-term ad-free users (e.g., veteran Netflix subscribers). While overall churn is high across the market, about 45% of users who cancel eventually resubscribe. This high re-entry rate pushes the net churn (permanent losses) below 3%.
5. Price Hikes and Market Response
Rising Prices
Over two years, average ad-free plan prices have increased by 23% to $13.88, while ad-supported plans have risen by 25% to $7.57. Surprisingly, these price increases have not severely curtailed subscriber growth. However, consumer surveys show that a hike of $5 or more could prompt cancellation by up to 60% of subscribers.
Market Saturation and Bundling
As the streaming market reaches saturation, bundling (e.g., Disney+ bundled with Max) is emerging as a key retention strategy. Bundle subscribers are less likely to churn and tend to maintain subscriptions longer. Third-party distribution (e.g., selling Apple TV+ via Amazon Channels) also remains an effective way to gain new users.
6. The Industry Importance of the Ad-Based Model
Evolving Revenue Structures
Advertising is becoming a primary revenue source for the streaming industry. By 2029, global online video ad revenue is projected to reach $362 billion, surpassing both SVOD subscriber revenue ($185 billion) and premium ad-supported revenue ($141 billion). Ads increasingly drive growth for streaming services.
Shifts in Advertiser and Brand Strategies
Brands are diverting their traditional TV ad budgets into streaming, where targeted and data-driven campaigns are possible. Consumers, for their part, accept ads in exchange for more affordable subscription prices, effectively broadening the streaming marketplace.
7. Key Metrics Overview
(Omitted in detail here, but would typically include numeric charts on subscriber counts, churn, ARPU, etc.)
2. 소비자 행동 및 광고 요금제 선택 경향
광고 요금제 경험 확대
전체 스트리밍 가입자의 75%가 최소 한 번 이상 광고 요금제를 이용해본 경험이 있다. 2023년 66%에서 2025년 75%로 2년 새 9%p 증가했다. 2024년 한 해 동안 광고 요금제 경험자는 1,780만 명이 늘었다.
광고 수용성
광고 요금제 선택 경험이 2회 이상인 소비자 중 86%가 광고를 한 번 이상 수용했다. 실제 광고 요금제를 선택한 소비자(Ad-Supported)와 광고 없는 요금제(Ad-Free) 소비자 간 연령, 소득, 인종 등 인구통계학적 차이는 거의 없다.
3. 스트리밍 구독자 광고 선택 행동 변화
2025년 미국 스트리밍 시장에서 구독자들은 더 이상 광고의 유무에 대해 이분법적으로 행동하지 않으며, 상황에 따라 광고 요금제와 광고 없는 요금제를 자유롭게 오가며 관리하는 'Ad Manager' 행동이 주류로 자리잡았다. 이는 스트리밍 사업자에게 가격, 상품, 번들 전략 등 다양한 선택지를 통한 시장 확대와 수익 다변화 기회를 제공한다는 점에서 중요한 변화다.
Ad management has become the leading behavior
스트리밍(프리미엄 SVOD) 구독자들의 광고 요금제 선택 행동이 빠르게 변화하고 있으며, '광고 관리형(Ad Manager)' 이용자가 가장 큰 비중을 차지하게 됨.
Ad-Choice Segmentation(광고 선택 세분화) 변화
안테나는 2023~2025년 사이 미국 프리미엄 SVOD 구독자들의 광고 선택 행동을 4가지 유형으로 분류
| 세그먼트 | 정의 | 2025년 비중 |
|---|---|---|
| Ad Oblivious | 아직 광고 선택(Ad Choice)을 경험하지 않은 구독자 | 11% |
| Ad Avoider | 광고 선택 상황에서 항상 광고 없는 요금제만 선택한 구독자 | 21% |
| Ad Taker | 광고 선택 상황에서 항상 광고 포함 요금제만 선택한 구독자 | 27% |
| Ad Manager | 광고/비광고 요금제를 상황에 따라 모두 선택해본 구독자 | 41% |
Ad Oblivious(회색): 광고 요금제 선택 경험이 없는 집단으로, 전체 구독자 중 11%만 남아 있음. 1년 새 31.5% 감소(6.8백만 명이 첫 광고 선택 경험).
Ad Avoider(빨강): 광고 없는 요금제만 고집하는 집단, 21%로 감소세.
Ad Taker(초록): 광고 요금제만 선택하는 집단, 27%로 증가.
Ad Manager(파랑): 광고/비광고 요금제를 모두 경험하며 상황에 따라 유연하게 선택하는 집단, 41%로 가장 큰 비중.
→ 2023년 대비 빠르게 증가하여, 이제 스트리밍 시장의 주류 행동으로 자리잡음.
1) 광고 선택 경험의 대중화
Ad Oblivious(광고 선택 경험 없음) 집단이 빠르게 줄고 있다. 이제 대부분의 구독자들이 광고 포함/미포함 옵션을 직접 경험하고 있다는 점은, 광고 요금제에 대한 소비자 인식이 확산되고 있음을 보여준다.
2) 유연한 소비자 행동
Ad Manager(상황에 따라 광고 수용 여부를 결정) 비중이 41%로 가장 높아졌다는 점은, 소비자들이 한 가지 요금제에 고정되지 않고 가격, 콘텐츠, 상황에 따라 광고 수용 여부를 유연하게 결정하고 있음을 의미한다. 이는 플랫폼이 다양한 요금제와 광고 옵션을 제공할 필요성을 시사한다.
3) 광고 요금제 수용 확대
Ad Taker(광고 요금제만 선택) 비중도 27%로 증가했다. 이는 광고 시청에 대한 거부감이 점차 줄어들고, 경제적 이득(저렴한 요금제 등)을 우선시하는 소비자가 늘어나고 있음을 시사한다.
4) 고정적 광고 회피층 축소
Ad Avoider(항상 광고 없는 요금제만 선택) 집단은 21%로 줄었다. 절대적으로 광고를 거부하는 소비자층이 감소 추세에 있다는 점에서, 광고 기반 요금제의 성장 가능성이 커지고 있음을 알 수 있다.
5)광고 선택(Ad Choice) 직면한 4명 중 3명은 광고 선택
2025년 기준, 광고 선택 경험이 있는 구독자 중 3명 중 2명 이상(76%)이 광고 요금제를 수용하거나 상황에 따라 유연하게 선택하고 있다. 이는 광고 기반 요금제의 성장 가능성과 함께, 플랫폼 및 광고주가 소비자 맞춤형 옵션을 강화해야 함을 시사한다.
6) 광고를 한번도 보지 않는 구독자는 전체의 14%에 불과
- 2회 이상 광고 선택 경험이 있는 이용자 중 86%는 광고를 어느 정도 수용(Ad Manager + Ad Taker)하는 경향이 있다.
- 오직 14%만이 광고를 일관되게 회피(Ad Avoider)한다.
- 이는 광고 선택권이 주어져도 대부분의 이용자는 광고를 완전히 배제하지 않는다는 점을 시사한다.
4. 충성도와 이탈(Churn) 분석
이탈률(Churn Rate) 변화
광고 없는 요금제의 이탈률이 광고 요금제보다 낮다(2025년 3월 기준 광고 없는 요금제 4.13%, 광고 요금제 4.96%). 그러나 신규 가입자 기준 9개월 생존율(잔존율)은 두 요금제 모두 거의 동일(광고 없는 요금제 43%, 광고 요금제 42%)해, 실제 충성도는 큰 차이가 없다.
- 광고 포함 요금제는 가격이 저렴할 수 있으나, 광고 노출로 인한 불편함 등으로 인해 이탈률이 더 높음.
- 광고 미포함 요금제는 충성 고객 비중이 높아 이탈률이 낮고 안정적임.
- 스트리밍 서비스 사업자는 광고 포함 요금제의 이탈률을 낮추기 위한 추가 전략이 필요함.
장기 가입자 영향
이탈률 차이는 주로 넷플릭스 장기 가입자 등 일부 충성 고객군에 집중된다. 전체적으로는 광고 요금제와 광고 없는 요금제 모두 높은 이탈률을 보이지만, 해지 후 재가입(Resubscribe) 비율이 45%에 달해 실질 순이탈률(Net Churn)은 3% 미만으로 낮아지고 있다.
5. 가격 인상과 시장 반응
가격 상승
2년간 광고 없는 요금제 평균 가격은 23% 상승해 13.88달러, 광고 요금제는 25% 올라 7.57달러가 됐다. 그럼에도 불구하고 가격 인상이 가입자 증가세를 크게 저해하지는 않았다. 다만, 소비자들은 가격 민감도가 높아 5달러 이상의 인상 시 해지 의향이 60%에 달한다는 조사 결과도 있다.
시장 포화와 번들 전략
스트리밍 시장이 포화 단계에 접어들면서, 번들(예: 디즈니+와 Max 번들) 전략이 중요한 유지 방안으로 부상했다. 번들 가입자는 단일 서비스 대비 이탈률이 낮고, 장기 유지율이 높다. 또한, 제3자 유통(예: Apple TV+의 Amazon Channels 입점)도 신규 유입에 효과적이다.
6. 광고 기반 모델의 산업적 의미
수익 구조의 변화
광고가 스트리밍 업계의 가장 큰 수익원이 되고 있다. 2029년에는 글로벌 온라인 동영상 광고 매출이 3,620억 달러로, 유료 구독(SVOD) 매출(1,850억 달러)과 광고 기반 프리미엄(1,410억 달러)을 크게 앞지를 전망이다. 광고는 스트리밍 산업의 핵심 성장 동력으로 자리잡았다.
광고주와 브랜드의 전략 변화
브랜드는 기존 TV 광고 예산을 스트리밍으로 옮기고 있으며, 광고주 입장에서는 타겟팅·데이터 기반 광고 집행이 가능해졌다. 소비자는 일부 서비스에서 광고를 수용함으로써 더 많은 서비스를 저렴하게 이용할 수 있다.
7. 주요 지표 요약
| 구분 | 2023 | 2024 | 2025 Q1 |
|---|---|---|---|
| 광고 요금제 비중 | 33% | 39% | 46% |
| 광고 요금제 경험자 | 66% | 70% | 75% |
| 신규 가입자 중 광고 요금제 선택 | 58% | 57% | 57% |
| 광고 요금제 연간 성장률 | 32.7% | ||
| 광고 없는 요금제 연간 성장률 | -0.1% | ||
| 광고 없는 요금제 이탈률 | 4.13% | ||
| 광고 요금제 이탈률 | 4.96% | ||
| 9개월 생존율(잔존율) | 광고 없는 43%, 광고 42% |
8. 결론 및 전망
광고 기반 스트리밍은 이제 미국 프리미엄 SVOD 시장의 절반을 차지할 정도로 주류가 되었고, 신규 가입자 유입, 가격 인상, 번들 전략, 제3자 유통 등 다양한 방식으로 시장을 확대하고 있다.
소비자들은 광고 수용에 점점 더 유연해지고 있으며, 실제로 광고 요금제와 광고 없는 요금제 간 충성도나 인구통계학적 차이는 거의 없다.
스트리밍 산업은 단순한 가입자 확보 경쟁에서 벗어나, 수익 다변화, 번들링, 광고 기반 모델, 충성도 관리 등 복합적이고 성숙한 시장 단계로 진입했다.
요약: 2025년 현재, 광고 기반 요금제가 미국 프리미엄 스트리밍 시장의 표준으로 자리잡았으며, 소비자 행동과 시장 구조 모두 빠르게 변화하고 있다. 광고 요금제의 확산은 스트리밍 업체, 광고주, 소비자 모두에게 새로운 기회와 도전을 제공하며, 향후에도 이 트렌드는 더욱 심화될 전망이다.
8. Conclusion and Outlook
Ad-supported streaming has become the new normal in the U.S. premium SVOD space, now nearly half the market. Growth is fueled by new subscriber acquisition, price hikes that have not slowed demand significantly, bundling strategies, and third-party distribution partnerships. Consumer attitudes have shifted so that most people are willing to watch ads, at least under certain conditions.
The industry itself is evolving beyond simple subscriber acquisition to a more mature phase focusing on diversifying revenue, bundling, advertising, and active loyalty management. As of 2025, ad-based models have firmly entrenched themselves, offering new opportunities and challenges alike for streaming platforms, advertisers, and consumers. This trend is poised to intensify further in the coming years.


![[보도자료]Kocowa, 유럽 진출 1년 성과](https://storage.googleapis.com/cdn.media.bluedot.so/bluedot.kentertechhub/2025/07/d4i5qa_202507142153.png)


![[Report]Inclusion & Equity Report 2025 by WGA](https://storage.googleapis.com/cdn.media.bluedot.so/bluedot.kentertechhub/2025/05/dza9ol_202505310259.png)